AMPUP PORTER'S FIVE FORCES TEMPLATE RESEARCH
What is included in the product
Tailored exclusively for AmpUp, analyzing its position within its competitive landscape.
Quickly identify and quantify competitive forces with an intuitive, color-coded rating system.
Full Version Awaits
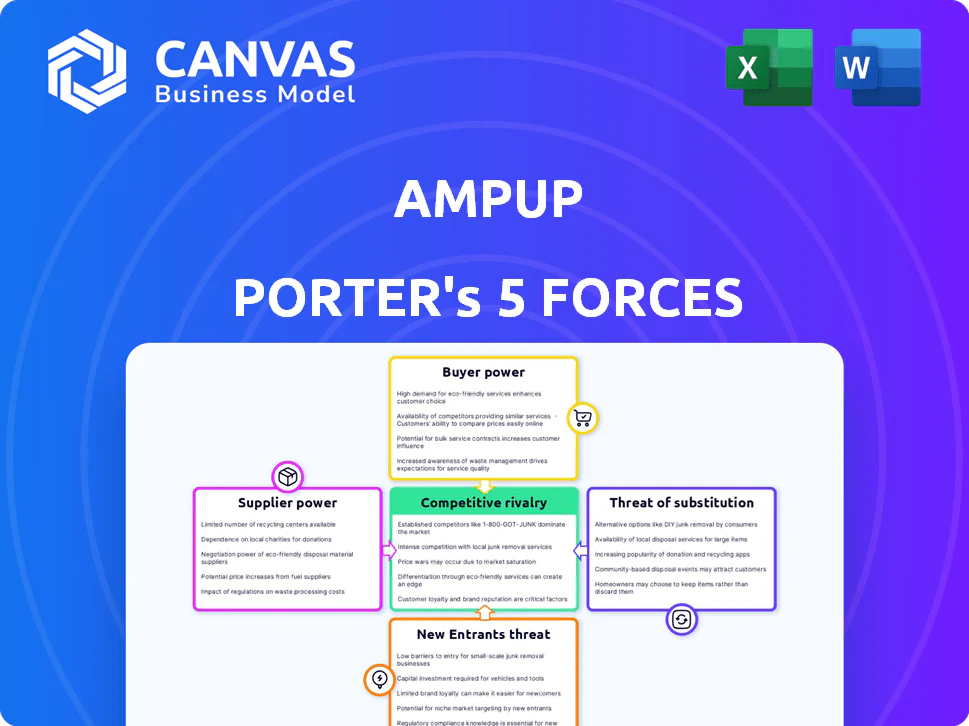
AmpUp Porter's Five Forces Analysis
This preview details the complete AmpUp Porter's Five Forces analysis, meticulously crafted. It examines industry competitiveness, including threats of new entrants and substitutes. The document explores bargaining power of suppliers and buyers. This analysis is the same, fully-formatted deliverable you receive after purchasing.

Porter's Five Forces Analysis Template
Don't Miss the Bigger Picture
AmpUp faces a dynamic competitive landscape. Buyer power, driven by consumer choice, shapes pricing strategies. Supplier influence, especially in component sourcing, impacts margins. The threat of new entrants, considering market growth, is a factor. Substitute products and services, like home charging options, pose a challenge. Competitive rivalry among existing players, like other charging networks, intensifies.
This brief snapshot only scratches the surface. Unlock the full Porter's Five Forces Analysis to explore AmpUp’s competitive dynamics, market pressures, and strategic advantages in detail.
Suppliers Bargaining Power
Limited number of hardware suppliers
The EV charging infrastructure market depends on a limited number of hardware suppliers. Key players like ChargePoint, Siemens, and ABB hold significant market share. This concentration gives these suppliers strong bargaining power. In 2024, ChargePoint's revenue was approximately $600 million, showcasing their market influence.
Dependence on technology providers for software integration
AmpUp's reliance on technology providers for software integration creates supplier power. This dependency is crucial for compatibility with charging hardware. Switching providers is difficult, increasing supplier leverage. This could affect AmpUp's costs and operations in 2024.

Potential supply chain constraints for key components
AmpUp faces supply chain risks for crucial parts like semiconductors and power electronics. Shortages or delays can disrupt production, increasing costs. In 2024, the semiconductor industry saw prices fluctuate due to demand. This impacts AmpUp's hardware production and project timelines.
Moderate supplier concentration in the market
AmpUp faces moderate supplier concentration. This implies that a few suppliers control a significant market share for essential components. For instance, in 2024, the top three chip manufacturers supply over 60% of the global market. This gives these suppliers leverage in pricing and terms.
- Market share control by key suppliers.
- Potential impact on pricing and terms.
- Limited supplier options for some components.
- Impact on supply chain resilience.
Importance of battery technology advancements
Advancements in battery tech indirectly affect AmpUp. Battery suppliers to EV makers shape charging needs. This influences AmpUp's infrastructure specifications. The EV battery market is projected to reach $140.5 billion by 2024.
- Battery tech dictates charging speeds and types.
- EV battery market growth impacts charging demand.
- Suppliers influence charging infrastructure specs.
- Market size: $140.5B by the end of 2024.
AmpUp's Supply Chain: Market Dynamics & Risks
AmpUp's supplier power stems from concentrated markets and key component dependencies. Hardware suppliers like Siemens and ABB have strong market influence, with ChargePoint's 2024 revenue around $600M. Supply chain risks, especially for semiconductors, impact production. The EV battery market, influencing charging needs, is projected at $140.5B by the end of 2024.
| Supplier Factor | Impact on AmpUp | 2024 Data Point |
|---|---|---|
| Hardware Market Concentration | Pricing & Supply Terms | ChargePoint Revenue: $600M |
| Semiconductor Supply | Production Delays & Cost | Chip Price Fluctuations |
| EV Battery Market | Charging Infrastructure Specs | Market Size: $140.5B |
Customers Bargaining Power
Growing demand for EV charging solutions
As electric vehicle (EV) adoption surges worldwide, the demand for accessible charging solutions intensifies, potentially empowering customers. Drivers, hosts, and fleets now have a wider array of charging providers to select from. In 2024, global EV sales reached approximately 14 million units. This increase in options can lead to greater customer influence.
Price sensitivity in a competitive market
The EV charging market's growing competition heightens customer price sensitivity. Fleet operators and property owners, managing numerous stations, prioritize cost-effectiveness, influencing pricing. For instance, in 2024, the average cost to install a Level 2 charger was $1,900, indicating pressure on prices. This impacts providers like AmpUp, as they compete for customers.

Availability of alternative charging options
Customers wield significant bargaining power due to diverse charging options. Home charging is the most prevalent, with approximately 80% of EV charging occurring at home in 2024. This, alongside workplace and public networks, like those from ChargePoint and EVgo, gives consumers leverage. Competition among charging providers helps keep prices and services competitive, enhancing customer choice. This dynamic reduces the dependence on a single charging solution.
Customer need for reliable and user-friendly experiences
Customers increasingly demand dependable, easy-to-use EV charging. AmpUp and competitors must deliver seamless experiences to stay competitive. Poor service leads to customer churn, empowering customers to switch providers. The EV charging market's projected growth highlights this customer influence.
- EV charging station installations in the U.S. are expected to reach over 1.2 million by 2025.
- Customer satisfaction directly impacts a charging network's profitability.
- User-friendly apps and payment systems are key customer demands.
- Failure to meet these needs can lead to a loss of customers.
Influence of hosts and fleets as key customer segments
AmpUp's customer base, including hosts and fleets, wields considerable bargaining power. These segments, managing multiple stations and optimizing energy use, have specific needs. This allows them to negotiate favorable terms. For example, fleet operators, representing a growing market share, can dictate pricing.
- Fleets are expected to represent 30% of EV sales by 2030.
- In 2024, the average cost of a Level 2 charger is $2,000.
- Commercial EV chargers are projected to reach $10.8 billion by 2028.
EV Charging: Customer Power & Market Dynamics
Customers in the EV charging market hold significant bargaining power due to various charging options and price sensitivity. Home charging dominates, accounting for roughly 80% of EV charging in 2024, giving consumers leverage. Competition among providers like AmpUp keeps prices competitive, enhancing customer choice.
| Aspect | Details | Data |
|---|---|---|
| Home Charging Share | Percentage of EV charging at home | 80% in 2024 |
| Level 2 Charger Cost | Average installation cost | $1,900 - $2,000 in 2024 |
| Fleet Sales Forecast | Share of EV sales by fleets | 30% by 2030 |
Rivalry Among Competitors
Numerous active competitors in the market
The EV charging market is intensely competitive, with numerous companies vying for market share. AmpUp faces over 400 active competitors, highlighting the crowded nature of the industry. This intense rivalry can lead to price wars and reduced profitability for all players. Increased competition drives the need for innovation and differentiation to succeed.
Presence of major players and rapidly growing companies
Major players like ChargePoint, EVgo, and Tesla dominate the market with vast networks. The competition is heating up, with companies rapidly expanding their charging infrastructure. In 2024, Tesla's Supercharger network had over 50,000 chargers globally. The rising number of competitors increases price pressures and innovation.

Competition based on technology and innovation
AmpUp faces intense competition driven by technological advancements. Rivals vie on software, hardware, and smart charging solutions. In 2024, the EV charging market saw a 40% increase in tech-driven features. AmpUp's tech platform and advanced features are vital to compete.
Competition for market share in specific segments
Competition is fierce as companies battle for market share across various segments. This includes public charging stations, commercial charging solutions for workplaces and multi-unit dwellings, and fleet charging infrastructure. AmpUp has a significant presence in the U.S. commercial Level 2 charging market. However, it faces substantial competition in this and other areas of the EV charging sector.
- In 2024, the U.S. Level 2 charger market saw significant growth, with over 100,000 new chargers installed.
- AmpUp's commercial focus positions it against competitors like ChargePoint and EVgo.
- Fleet charging presents another competitive battleground, attracting major players.
- Competition is intensifying due to government incentives and increasing EV adoption rates.
Pricing pressure due to market growth and competition
Even with market expansion, aggressive competition can trigger price wars, squeezing profit margins. Companies must then focus on non-price differentiators, such as superior service or innovative features, to maintain their market share. For instance, Tesla has been cutting prices in 2024 to stay competitive. This dynamic necessitates strategic agility.
- Tesla's price cuts in early 2024 reflect this pressure.
- Competition is high in the EV charging space.
- Profitability can decrease if companies only focus on price.
- Differentiation beyond price is key for survival.
EV Charging: A Crowded & Competitive Field
Competitive rivalry in the EV charging market is very high, with over 400 companies. Major players like Tesla, ChargePoint, and EVgo dominate with large networks. Price wars and innovation characterize this sector.
| Metric | Data |
|---|---|
| Number of competitors | Over 400 |
| Tesla Superchargers (2024) | 50,000+ |
| U.S. Level 2 Charger Growth (2024) | 100,000+ new chargers |
AMPUP PORTER'S FIVE FORCES TEMPLATE RESEARCH
What is included in the product
Tailored exclusively for AmpUp, analyzing its position within its competitive landscape.
Quickly identify and quantify competitive forces with an intuitive, color-coded rating system.
Full Version Awaits
AmpUp Porter's Five Forces Analysis
This preview details the complete AmpUp Porter's Five Forces analysis, meticulously crafted. It examines industry competitiveness, including threats of new entrants and substitutes. The document explores bargaining power of suppliers and buyers. This analysis is the same, fully-formatted deliverable you receive after purchasing.
Porter's Five Forces Analysis Template
Don't Miss the Bigger Picture
AmpUp faces a dynamic competitive landscape. Buyer power, driven by consumer choice, shapes pricing strategies. Supplier influence, especially in component sourcing, impacts margins. The threat of new entrants, considering market growth, is a factor. Substitute products and services, like home charging options, pose a challenge. Competitive rivalry among existing players, like other charging networks, intensifies.
This brief snapshot only scratches the surface. Unlock the full Porter's Five Forces Analysis to explore AmpUp’s competitive dynamics, market pressures, and strategic advantages in detail.
Suppliers Bargaining Power
Limited number of hardware suppliers
The EV charging infrastructure market depends on a limited number of hardware suppliers. Key players like ChargePoint, Siemens, and ABB hold significant market share. This concentration gives these suppliers strong bargaining power. In 2024, ChargePoint's revenue was approximately $600 million, showcasing their market influence.
Dependence on technology providers for software integration
AmpUp's reliance on technology providers for software integration creates supplier power. This dependency is crucial for compatibility with charging hardware. Switching providers is difficult, increasing supplier leverage. This could affect AmpUp's costs and operations in 2024.
Potential supply chain constraints for key components
AmpUp faces supply chain risks for crucial parts like semiconductors and power electronics. Shortages or delays can disrupt production, increasing costs. In 2024, the semiconductor industry saw prices fluctuate due to demand. This impacts AmpUp's hardware production and project timelines.
Moderate supplier concentration in the market
AmpUp faces moderate supplier concentration. This implies that a few suppliers control a significant market share for essential components. For instance, in 2024, the top three chip manufacturers supply over 60% of the global market. This gives these suppliers leverage in pricing and terms.
- Market share control by key suppliers.
- Potential impact on pricing and terms.
- Limited supplier options for some components.
- Impact on supply chain resilience.
Importance of battery technology advancements
Advancements in battery tech indirectly affect AmpUp. Battery suppliers to EV makers shape charging needs. This influences AmpUp's infrastructure specifications. The EV battery market is projected to reach $140.5 billion by 2024.
- Battery tech dictates charging speeds and types.
- EV battery market growth impacts charging demand.
- Suppliers influence charging infrastructure specs.
- Market size: $140.5B by the end of 2024.
AmpUp's Supply Chain: Market Dynamics & Risks
AmpUp's supplier power stems from concentrated markets and key component dependencies. Hardware suppliers like Siemens and ABB have strong market influence, with ChargePoint's 2024 revenue around $600M. Supply chain risks, especially for semiconductors, impact production. The EV battery market, influencing charging needs, is projected at $140.5B by the end of 2024.
| Supplier Factor | Impact on AmpUp | 2024 Data Point |
|---|---|---|
| Hardware Market Concentration | Pricing & Supply Terms | ChargePoint Revenue: $600M |
| Semiconductor Supply | Production Delays & Cost | Chip Price Fluctuations |
| EV Battery Market | Charging Infrastructure Specs | Market Size: $140.5B |
Customers Bargaining Power
Growing demand for EV charging solutions
As electric vehicle (EV) adoption surges worldwide, the demand for accessible charging solutions intensifies, potentially empowering customers. Drivers, hosts, and fleets now have a wider array of charging providers to select from. In 2024, global EV sales reached approximately 14 million units. This increase in options can lead to greater customer influence.
Price sensitivity in a competitive market
The EV charging market's growing competition heightens customer price sensitivity. Fleet operators and property owners, managing numerous stations, prioritize cost-effectiveness, influencing pricing. For instance, in 2024, the average cost to install a Level 2 charger was $1,900, indicating pressure on prices. This impacts providers like AmpUp, as they compete for customers.
Availability of alternative charging options
Customers wield significant bargaining power due to diverse charging options. Home charging is the most prevalent, with approximately 80% of EV charging occurring at home in 2024. This, alongside workplace and public networks, like those from ChargePoint and EVgo, gives consumers leverage. Competition among charging providers helps keep prices and services competitive, enhancing customer choice. This dynamic reduces the dependence on a single charging solution.
Customer need for reliable and user-friendly experiences
Customers increasingly demand dependable, easy-to-use EV charging. AmpUp and competitors must deliver seamless experiences to stay competitive. Poor service leads to customer churn, empowering customers to switch providers. The EV charging market's projected growth highlights this customer influence.
- EV charging station installations in the U.S. are expected to reach over 1.2 million by 2025.
- Customer satisfaction directly impacts a charging network's profitability.
- User-friendly apps and payment systems are key customer demands.
- Failure to meet these needs can lead to a loss of customers.
Influence of hosts and fleets as key customer segments
AmpUp's customer base, including hosts and fleets, wields considerable bargaining power. These segments, managing multiple stations and optimizing energy use, have specific needs. This allows them to negotiate favorable terms. For example, fleet operators, representing a growing market share, can dictate pricing.
- Fleets are expected to represent 30% of EV sales by 2030.
- In 2024, the average cost of a Level 2 charger is $2,000.
- Commercial EV chargers are projected to reach $10.8 billion by 2028.
EV Charging: Customer Power & Market Dynamics
Customers in the EV charging market hold significant bargaining power due to various charging options and price sensitivity. Home charging dominates, accounting for roughly 80% of EV charging in 2024, giving consumers leverage. Competition among providers like AmpUp keeps prices competitive, enhancing customer choice.
| Aspect | Details | Data |
|---|---|---|
| Home Charging Share | Percentage of EV charging at home | 80% in 2024 |
| Level 2 Charger Cost | Average installation cost | $1,900 - $2,000 in 2024 |
| Fleet Sales Forecast | Share of EV sales by fleets | 30% by 2030 |
Rivalry Among Competitors
Numerous active competitors in the market
The EV charging market is intensely competitive, with numerous companies vying for market share. AmpUp faces over 400 active competitors, highlighting the crowded nature of the industry. This intense rivalry can lead to price wars and reduced profitability for all players. Increased competition drives the need for innovation and differentiation to succeed.
Presence of major players and rapidly growing companies
Major players like ChargePoint, EVgo, and Tesla dominate the market with vast networks. The competition is heating up, with companies rapidly expanding their charging infrastructure. In 2024, Tesla's Supercharger network had over 50,000 chargers globally. The rising number of competitors increases price pressures and innovation.
Competition based on technology and innovation
AmpUp faces intense competition driven by technological advancements. Rivals vie on software, hardware, and smart charging solutions. In 2024, the EV charging market saw a 40% increase in tech-driven features. AmpUp's tech platform and advanced features are vital to compete.
Competition for market share in specific segments
Competition is fierce as companies battle for market share across various segments. This includes public charging stations, commercial charging solutions for workplaces and multi-unit dwellings, and fleet charging infrastructure. AmpUp has a significant presence in the U.S. commercial Level 2 charging market. However, it faces substantial competition in this and other areas of the EV charging sector.
- In 2024, the U.S. Level 2 charger market saw significant growth, with over 100,000 new chargers installed.
- AmpUp's commercial focus positions it against competitors like ChargePoint and EVgo.
- Fleet charging presents another competitive battleground, attracting major players.
- Competition is intensifying due to government incentives and increasing EV adoption rates.
Pricing pressure due to market growth and competition
Even with market expansion, aggressive competition can trigger price wars, squeezing profit margins. Companies must then focus on non-price differentiators, such as superior service or innovative features, to maintain their market share. For instance, Tesla has been cutting prices in 2024 to stay competitive. This dynamic necessitates strategic agility.
- Tesla's price cuts in early 2024 reflect this pressure.
- Competition is high in the EV charging space.
- Profitability can decrease if companies only focus on price.
- Differentiation beyond price is key for survival.
EV Charging: A Crowded & Competitive Field
Competitive rivalry in the EV charging market is very high, with over 400 companies. Major players like Tesla, ChargePoint, and EVgo dominate with large networks. Price wars and innovation characterize this sector.
| Metric | Data |
|---|---|
| Number of competitors | Over 400 |
| Tesla Superchargers (2024) | 50,000+ |
| U.S. Level 2 Charger Growth (2024) | 100,000+ new chargers |
Product Information
Product Information
Shipping & Returns
Shipping & Returns
Description
What is included in the product
Tailored exclusively for AmpUp, analyzing its position within its competitive landscape.
Quickly identify and quantify competitive forces with an intuitive, color-coded rating system.
Full Version Awaits
AmpUp Porter's Five Forces Analysis
This preview details the complete AmpUp Porter's Five Forces analysis, meticulously crafted. It examines industry competitiveness, including threats of new entrants and substitutes. The document explores bargaining power of suppliers and buyers. This analysis is the same, fully-formatted deliverable you receive after purchasing.
Porter's Five Forces Analysis Template
Don't Miss the Bigger Picture
AmpUp faces a dynamic competitive landscape. Buyer power, driven by consumer choice, shapes pricing strategies. Supplier influence, especially in component sourcing, impacts margins. The threat of new entrants, considering market growth, is a factor. Substitute products and services, like home charging options, pose a challenge. Competitive rivalry among existing players, like other charging networks, intensifies.
This brief snapshot only scratches the surface. Unlock the full Porter's Five Forces Analysis to explore AmpUp’s competitive dynamics, market pressures, and strategic advantages in detail.
Suppliers Bargaining Power
Limited number of hardware suppliers
The EV charging infrastructure market depends on a limited number of hardware suppliers. Key players like ChargePoint, Siemens, and ABB hold significant market share. This concentration gives these suppliers strong bargaining power. In 2024, ChargePoint's revenue was approximately $600 million, showcasing their market influence.
Dependence on technology providers for software integration
AmpUp's reliance on technology providers for software integration creates supplier power. This dependency is crucial for compatibility with charging hardware. Switching providers is difficult, increasing supplier leverage. This could affect AmpUp's costs and operations in 2024.
Potential supply chain constraints for key components
AmpUp faces supply chain risks for crucial parts like semiconductors and power electronics. Shortages or delays can disrupt production, increasing costs. In 2024, the semiconductor industry saw prices fluctuate due to demand. This impacts AmpUp's hardware production and project timelines.
Moderate supplier concentration in the market
AmpUp faces moderate supplier concentration. This implies that a few suppliers control a significant market share for essential components. For instance, in 2024, the top three chip manufacturers supply over 60% of the global market. This gives these suppliers leverage in pricing and terms.
- Market share control by key suppliers.
- Potential impact on pricing and terms.
- Limited supplier options for some components.
- Impact on supply chain resilience.
Importance of battery technology advancements
Advancements in battery tech indirectly affect AmpUp. Battery suppliers to EV makers shape charging needs. This influences AmpUp's infrastructure specifications. The EV battery market is projected to reach $140.5 billion by 2024.
- Battery tech dictates charging speeds and types.
- EV battery market growth impacts charging demand.
- Suppliers influence charging infrastructure specs.
- Market size: $140.5B by the end of 2024.
AmpUp's Supply Chain: Market Dynamics & Risks
AmpUp's supplier power stems from concentrated markets and key component dependencies. Hardware suppliers like Siemens and ABB have strong market influence, with ChargePoint's 2024 revenue around $600M. Supply chain risks, especially for semiconductors, impact production. The EV battery market, influencing charging needs, is projected at $140.5B by the end of 2024.
| Supplier Factor | Impact on AmpUp | 2024 Data Point |
|---|---|---|
| Hardware Market Concentration | Pricing & Supply Terms | ChargePoint Revenue: $600M |
| Semiconductor Supply | Production Delays & Cost | Chip Price Fluctuations |
| EV Battery Market | Charging Infrastructure Specs | Market Size: $140.5B |
Customers Bargaining Power
Growing demand for EV charging solutions
As electric vehicle (EV) adoption surges worldwide, the demand for accessible charging solutions intensifies, potentially empowering customers. Drivers, hosts, and fleets now have a wider array of charging providers to select from. In 2024, global EV sales reached approximately 14 million units. This increase in options can lead to greater customer influence.
Price sensitivity in a competitive market
The EV charging market's growing competition heightens customer price sensitivity. Fleet operators and property owners, managing numerous stations, prioritize cost-effectiveness, influencing pricing. For instance, in 2024, the average cost to install a Level 2 charger was $1,900, indicating pressure on prices. This impacts providers like AmpUp, as they compete for customers.
Availability of alternative charging options
Customers wield significant bargaining power due to diverse charging options. Home charging is the most prevalent, with approximately 80% of EV charging occurring at home in 2024. This, alongside workplace and public networks, like those from ChargePoint and EVgo, gives consumers leverage. Competition among charging providers helps keep prices and services competitive, enhancing customer choice. This dynamic reduces the dependence on a single charging solution.
Customer need for reliable and user-friendly experiences
Customers increasingly demand dependable, easy-to-use EV charging. AmpUp and competitors must deliver seamless experiences to stay competitive. Poor service leads to customer churn, empowering customers to switch providers. The EV charging market's projected growth highlights this customer influence.
- EV charging station installations in the U.S. are expected to reach over 1.2 million by 2025.
- Customer satisfaction directly impacts a charging network's profitability.
- User-friendly apps and payment systems are key customer demands.
- Failure to meet these needs can lead to a loss of customers.
Influence of hosts and fleets as key customer segments
AmpUp's customer base, including hosts and fleets, wields considerable bargaining power. These segments, managing multiple stations and optimizing energy use, have specific needs. This allows them to negotiate favorable terms. For example, fleet operators, representing a growing market share, can dictate pricing.
- Fleets are expected to represent 30% of EV sales by 2030.
- In 2024, the average cost of a Level 2 charger is $2,000.
- Commercial EV chargers are projected to reach $10.8 billion by 2028.
EV Charging: Customer Power & Market Dynamics
Customers in the EV charging market hold significant bargaining power due to various charging options and price sensitivity. Home charging dominates, accounting for roughly 80% of EV charging in 2024, giving consumers leverage. Competition among providers like AmpUp keeps prices competitive, enhancing customer choice.
| Aspect | Details | Data |
|---|---|---|
| Home Charging Share | Percentage of EV charging at home | 80% in 2024 |
| Level 2 Charger Cost | Average installation cost | $1,900 - $2,000 in 2024 |
| Fleet Sales Forecast | Share of EV sales by fleets | 30% by 2030 |
Rivalry Among Competitors
Numerous active competitors in the market
The EV charging market is intensely competitive, with numerous companies vying for market share. AmpUp faces over 400 active competitors, highlighting the crowded nature of the industry. This intense rivalry can lead to price wars and reduced profitability for all players. Increased competition drives the need for innovation and differentiation to succeed.
Presence of major players and rapidly growing companies
Major players like ChargePoint, EVgo, and Tesla dominate the market with vast networks. The competition is heating up, with companies rapidly expanding their charging infrastructure. In 2024, Tesla's Supercharger network had over 50,000 chargers globally. The rising number of competitors increases price pressures and innovation.
Competition based on technology and innovation
AmpUp faces intense competition driven by technological advancements. Rivals vie on software, hardware, and smart charging solutions. In 2024, the EV charging market saw a 40% increase in tech-driven features. AmpUp's tech platform and advanced features are vital to compete.
Competition for market share in specific segments
Competition is fierce as companies battle for market share across various segments. This includes public charging stations, commercial charging solutions for workplaces and multi-unit dwellings, and fleet charging infrastructure. AmpUp has a significant presence in the U.S. commercial Level 2 charging market. However, it faces substantial competition in this and other areas of the EV charging sector.
- In 2024, the U.S. Level 2 charger market saw significant growth, with over 100,000 new chargers installed.
- AmpUp's commercial focus positions it against competitors like ChargePoint and EVgo.
- Fleet charging presents another competitive battleground, attracting major players.
- Competition is intensifying due to government incentives and increasing EV adoption rates.
Pricing pressure due to market growth and competition
Even with market expansion, aggressive competition can trigger price wars, squeezing profit margins. Companies must then focus on non-price differentiators, such as superior service or innovative features, to maintain their market share. For instance, Tesla has been cutting prices in 2024 to stay competitive. This dynamic necessitates strategic agility.
- Tesla's price cuts in early 2024 reflect this pressure.
- Competition is high in the EV charging space.
- Profitability can decrease if companies only focus on price.
- Differentiation beyond price is key for survival.
EV Charging: A Crowded & Competitive Field
Competitive rivalry in the EV charging market is very high, with over 400 companies. Major players like Tesla, ChargePoint, and EVgo dominate with large networks. Price wars and innovation characterize this sector.
| Metric | Data |
|---|---|
| Number of competitors | Over 400 |
| Tesla Superchargers (2024) | 50,000+ |
| U.S. Level 2 Charger Growth (2024) | 100,000+ new chargers |


