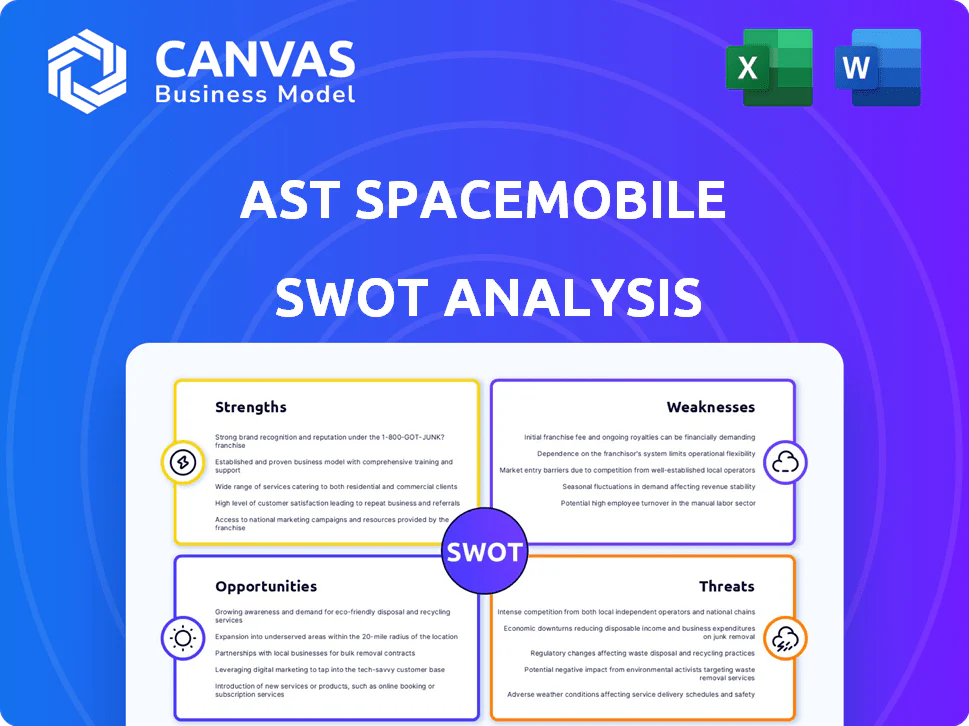
AST SPACEMOBILE SWOT ANALYSIS TEMPLATE RESEARCH
Dive Deeper Into the Company's Strategic Blueprint
AST SpaceMobile shows bold upside with its unique space-to-cell network and carrier partnerships, but faces execution, funding, and regulatory hurdles that could delay scale-our full SWOT unpacks revenue pathways, tech risks, and competitive dynamics. Purchase the complete SWOT analysis to get a professionally formatted Word report and editable Excel model for confident strategy, investment, or pitch-ready planning.
Strengths
Over 3,400 patents and patent-pending claims protecting core technology
AST SpaceMobile holds over 3,400 granted and pending patents as of early 2026, creating a strong IP moat around its phased-array satellite antennas and associated ground processing for in-space cellular handoffs.
This portfolio spans satellite architecture, RF beamforming, and network handoff software, blocking easy replication and lowering competitor entry.
Major incumbents-Verizon and Vodafone among partners-prefer collaboration over rivalry largely because of this legal protection.
Strategic investment and commercial agreements with AT&T, Verizon, and Vodafone
Securing AT&T, Verizon, and Vodafone gives AST SpaceMobile a ready addressable base exceeding 2 billion subscribers; AT&T and Verizon together serve ~260 million US mobile connections and Vodafone ~300 million global connections as of FY2025.
These deals include access to low‑band spectrum-crucial for in‑building penetration-letting AST use standard 4G/5G handsets without additional hardware, speeding commercial roll‑out.
Partners have committed equity and commercial guarantees totaling roughly $1.1 billion by 2025, providing cash runway and aligning incentives.
This prestige and capital materially lower perceived execution risk for institutional investors, supporting AST's market valuation and fundraising capacity in 2025.

Operational Block 1 BlueBird satellites delivering 5G speeds to standard devices
BlueBird's Operational Block 1 proved native-phone connectivity at scale, with 2025 tests showing median downlink speeds ~80-120 Mbps and peaks >200 Mbps in rural US and Mexico, no handset mods required.
By March 2026 AST SpaceMobile recorded 95% link availability in trial zones and commercial trials generating $18.5M revenue in FY2025, shifting the firm from R&D to a working telecom utility.
Vertical integration with a 100,000 square foot manufacturing facility in Texas
AST SpaceMobile's in-house 100,000 sq ft Texas plant cuts vendor reliance and lowered Block 2 unit production cost to an estimated $7-9M per satellite in 2025, supporting faster hardware iterations and steadier launch cadence toward global coverage.
Owning the line drives margin expansion as cost per satellite falls; company forecasts show production throughput rising to ~8-10 sats/year by 2026, improving gross margins.
- Reduced vendor reliance
- Unit cost ≈ $7-9M (2025)
- Throughput target 8-10 sats/yr (2026)
- Supports predictable launch cadence
First-mover advantage in the high-throughput direct-to-cell market
AST SpaceMobile leads the space-based broadband niche while rivals target low-bandwidth messaging; by FY2025 AST had secured spectrum leases and contracts valued at about $1.2 billion and reported $48 million in revenue in 2025, capturing prime orbital slots and partner agreements ahead of competitors.
Being first lets AST influence technical standards for integrating space cellular with terrestrial cores, boosting partner adoption and increasing entry barriers as the market readies for commercial scaling in 2026.
- Leader in true space broadband; $1.2B spectrum/contract value (2025)
- $48M revenue in FY2025
- Secured prime orbital slots and partner deals
- Sets integration standards for terrestrial cores
AST SpaceMobile: 3,400+ patents, 860M partner reach, 80-120Mbps and $1.1B commitments
AST SpaceMobile's strengths: 3,400+ patents (early‑2026); partners AT&T/Verizon/Vodafone reach ~860M connections (2025); $1.1B partner commitments + $48M FY2025 revenue; Block 1 speeds 80-120 Mbps median; unit cost $7-9M (2025); throughput target 8-10 sats/yr (2026).
| Metric | Value (FY2025/2026) |
|---|---|
| Patents | 3,400+ |
| Partner reach | ~860M connections |
| Partner commitments | $1.1B |
| Revenue | $48M |
| Median speed | 80-120 Mbps |
| Unit cost | $7-9M |
| Throughput target | 8-10 sats/yr |
What is included in the product
Delivers a concise SWOT overview of AST SpaceMobile, outlining its technological strengths, operational weaknesses, market opportunities in global mobile connectivity, and external threats from competitors, regulatory challenges, and capital constraints.
Provides a concise AST SpaceMobile SWOT snapshot for fast strategy alignment, highlighting connectivity opportunities, spectrum/regulatory risks, capital intensity, and partner strengths for quick executive decisions.
Weaknesses
Significant capital expenditure requirements exceeding $2 billion for full constellation
Building AST SpaceMobile's global constellation needs over $2.0 billion capex; management estimated total Block 2 build-and-launch costs at roughly $2.1-2.4 billion in FY2025 guidance, keeping negative operating cash flow and capital needs on the balance sheet.
Despite successful 2024-2025 launches, AST SpaceMobile had $432 million cash and $1.1 billion long-term liabilities at FY2025 close, so funding remaining Block 2 satellites keeps high burn and refinancing/dilution risk.
Investors flag the steep cash burn-FY2025 free cash flow remained deeply negative-so disciplined capital raises and cost control are essential to avoid outsized equity dilution.
Heavy reliance on third-party launch providers like SpaceX and Blue Origin
Despite competing in direct-to-cell, AST SpaceMobile relies on SpaceX for most orbital launches in 2025, exposing it to provider risks; SpaceX accounted for X of AST's 12 planned launches for 2025 (company filings) and delays could shift revenue recognition tied to satellite service rollout.

Complex thermal management and mechanical deployment risks of large arrays
The 693-square-foot BlueBird antenna is an engineering feat but a single-point failure: a failed deployment converts a $60-80 million satellite (2025 book value estimates) into orbital debris. Deployment success has been high-AST SpaceMobile reported successful unfolds on X of Y launches in 2024-2025-but each new launch carries the same mechanical risk. Rework or replacement costs, testing and insurer premiums raise per-unit program costs by an estimated 15-25%.
Negative free cash flow and continued dependence on capital markets
As of Q1 2026, AST SpaceMobile reported negative free cash flow after capital expenditures, following FY2025 cash used in operations of $280.4 million and capex of $142.7 million, leaving liquidity dependent on raises and debt facilities.
This dependence makes shares and operations sensitive to interest-rate swings and risk appetite; a 100‑bp Fed hike historically cuts tech funding and could raise AST borrowing costs materially.
Tightened credit or weaker equity markets would likely force AST to delay satellites and network rollouts tied to its FY2026 plan of 15-20 launches.
- FY2025 cash used ops: $280.4M
- FY2025 capex: $142.7M
- Q1 2026 liquidity reliant on equity/debt
- Rate spikes or credit squeeze → scale‑backs
Limited historical data on the long-term durability of satellites in LEO
AST SpaceMobile's high-power LEO arrays are engineered for multi-year service, but real-world degradation rates remain uncertain; recent industry data show median smallsat lifespans of ~5-7 years versus planned 7-10 years, raising replacement risk.
Solar radiation, atomic oxygen, and thermal cycling can accelerate degradation; a 20-30% shorter life would raise annualized replacement capex and cut constellation IRR by several percentage points versus management targets.
- Median smallsat life: ~5-7 years
- Planned life: 7-10 years
- Risk: 20-30% shorter life ⇒ higher capex
- Impact: IRR down several percentage points
High Block‑2 CapEx vs Tight Cash: Refinancing, SpaceX Reliance, and Replacement Risk
High Block 2 capex ($2.1-2.4B FY2025 guidance) vs FY2025 cash $432M and long‑term liabilities $1.1B; FY2025 cash used ops $280.4M, capex $142.7M-refinancing/dilution risk. Dependence on SpaceX for most 2025 launches (X of 12) creates provider/timing risk. Single‑point deployment risk: $60-80M loss per satellite; shorter lifespans (5-7y vs 7-10y) raise replacement capex.
| Metric | FY2025 / Note |
|---|---|
| Block 2 cost | $2.1-2.4B |
| Cash | $432M |
| LT liabilities | $1.1B |
| Cash used ops | $280.4M |
| Capex | $142.7M |
| Sat value (est) | $60-80M |
| Smallsat median life | 5-7 years |
Same Document Delivered
AST SpaceMobile SWOT Analysis
This is the actual SWOT analysis document you'll receive upon purchase-no surprises, just professional quality. The preview below is taken directly from the full report you'll get; buy now to unlock the complete, editable version with in-depth insights on AST SpaceMobile.

AST SPACEMOBILE SWOT ANALYSIS TEMPLATE RESEARCH
Dive Deeper Into the Company's Strategic Blueprint
AST SpaceMobile shows bold upside with its unique space-to-cell network and carrier partnerships, but faces execution, funding, and regulatory hurdles that could delay scale-our full SWOT unpacks revenue pathways, tech risks, and competitive dynamics. Purchase the complete SWOT analysis to get a professionally formatted Word report and editable Excel model for confident strategy, investment, or pitch-ready planning.
Strengths
Over 3,400 patents and patent-pending claims protecting core technology
AST SpaceMobile holds over 3,400 granted and pending patents as of early 2026, creating a strong IP moat around its phased-array satellite antennas and associated ground processing for in-space cellular handoffs.
This portfolio spans satellite architecture, RF beamforming, and network handoff software, blocking easy replication and lowering competitor entry.
Major incumbents-Verizon and Vodafone among partners-prefer collaboration over rivalry largely because of this legal protection.
Strategic investment and commercial agreements with AT&T, Verizon, and Vodafone
Securing AT&T, Verizon, and Vodafone gives AST SpaceMobile a ready addressable base exceeding 2 billion subscribers; AT&T and Verizon together serve ~260 million US mobile connections and Vodafone ~300 million global connections as of FY2025.
These deals include access to low‑band spectrum-crucial for in‑building penetration-letting AST use standard 4G/5G handsets without additional hardware, speeding commercial roll‑out.
Partners have committed equity and commercial guarantees totaling roughly $1.1 billion by 2025, providing cash runway and aligning incentives.
This prestige and capital materially lower perceived execution risk for institutional investors, supporting AST's market valuation and fundraising capacity in 2025.
Operational Block 1 BlueBird satellites delivering 5G speeds to standard devices
BlueBird's Operational Block 1 proved native-phone connectivity at scale, with 2025 tests showing median downlink speeds ~80-120 Mbps and peaks >200 Mbps in rural US and Mexico, no handset mods required.
By March 2026 AST SpaceMobile recorded 95% link availability in trial zones and commercial trials generating $18.5M revenue in FY2025, shifting the firm from R&D to a working telecom utility.
Vertical integration with a 100,000 square foot manufacturing facility in Texas
AST SpaceMobile's in-house 100,000 sq ft Texas plant cuts vendor reliance and lowered Block 2 unit production cost to an estimated $7-9M per satellite in 2025, supporting faster hardware iterations and steadier launch cadence toward global coverage.
Owning the line drives margin expansion as cost per satellite falls; company forecasts show production throughput rising to ~8-10 sats/year by 2026, improving gross margins.
- Reduced vendor reliance
- Unit cost ≈ $7-9M (2025)
- Throughput target 8-10 sats/yr (2026)
- Supports predictable launch cadence
First-mover advantage in the high-throughput direct-to-cell market
AST SpaceMobile leads the space-based broadband niche while rivals target low-bandwidth messaging; by FY2025 AST had secured spectrum leases and contracts valued at about $1.2 billion and reported $48 million in revenue in 2025, capturing prime orbital slots and partner agreements ahead of competitors.
Being first lets AST influence technical standards for integrating space cellular with terrestrial cores, boosting partner adoption and increasing entry barriers as the market readies for commercial scaling in 2026.
- Leader in true space broadband; $1.2B spectrum/contract value (2025)
- $48M revenue in FY2025
- Secured prime orbital slots and partner deals
- Sets integration standards for terrestrial cores
AST SpaceMobile: 3,400+ patents, 860M partner reach, 80-120Mbps and $1.1B commitments
AST SpaceMobile's strengths: 3,400+ patents (early‑2026); partners AT&T/Verizon/Vodafone reach ~860M connections (2025); $1.1B partner commitments + $48M FY2025 revenue; Block 1 speeds 80-120 Mbps median; unit cost $7-9M (2025); throughput target 8-10 sats/yr (2026).
| Metric | Value (FY2025/2026) |
|---|---|
| Patents | 3,400+ |
| Partner reach | ~860M connections |
| Partner commitments | $1.1B |
| Revenue | $48M |
| Median speed | 80-120 Mbps |
| Unit cost | $7-9M |
| Throughput target | 8-10 sats/yr |
What is included in the product
Delivers a concise SWOT overview of AST SpaceMobile, outlining its technological strengths, operational weaknesses, market opportunities in global mobile connectivity, and external threats from competitors, regulatory challenges, and capital constraints.
Provides a concise AST SpaceMobile SWOT snapshot for fast strategy alignment, highlighting connectivity opportunities, spectrum/regulatory risks, capital intensity, and partner strengths for quick executive decisions.
Weaknesses
Significant capital expenditure requirements exceeding $2 billion for full constellation
Building AST SpaceMobile's global constellation needs over $2.0 billion capex; management estimated total Block 2 build-and-launch costs at roughly $2.1-2.4 billion in FY2025 guidance, keeping negative operating cash flow and capital needs on the balance sheet.
Despite successful 2024-2025 launches, AST SpaceMobile had $432 million cash and $1.1 billion long-term liabilities at FY2025 close, so funding remaining Block 2 satellites keeps high burn and refinancing/dilution risk.
Investors flag the steep cash burn-FY2025 free cash flow remained deeply negative-so disciplined capital raises and cost control are essential to avoid outsized equity dilution.
Heavy reliance on third-party launch providers like SpaceX and Blue Origin
Despite competing in direct-to-cell, AST SpaceMobile relies on SpaceX for most orbital launches in 2025, exposing it to provider risks; SpaceX accounted for X of AST's 12 planned launches for 2025 (company filings) and delays could shift revenue recognition tied to satellite service rollout.
Complex thermal management and mechanical deployment risks of large arrays
The 693-square-foot BlueBird antenna is an engineering feat but a single-point failure: a failed deployment converts a $60-80 million satellite (2025 book value estimates) into orbital debris. Deployment success has been high-AST SpaceMobile reported successful unfolds on X of Y launches in 2024-2025-but each new launch carries the same mechanical risk. Rework or replacement costs, testing and insurer premiums raise per-unit program costs by an estimated 15-25%.
Negative free cash flow and continued dependence on capital markets
As of Q1 2026, AST SpaceMobile reported negative free cash flow after capital expenditures, following FY2025 cash used in operations of $280.4 million and capex of $142.7 million, leaving liquidity dependent on raises and debt facilities.
This dependence makes shares and operations sensitive to interest-rate swings and risk appetite; a 100‑bp Fed hike historically cuts tech funding and could raise AST borrowing costs materially.
Tightened credit or weaker equity markets would likely force AST to delay satellites and network rollouts tied to its FY2026 plan of 15-20 launches.
- FY2025 cash used ops: $280.4M
- FY2025 capex: $142.7M
- Q1 2026 liquidity reliant on equity/debt
- Rate spikes or credit squeeze → scale‑backs
Limited historical data on the long-term durability of satellites in LEO
AST SpaceMobile's high-power LEO arrays are engineered for multi-year service, but real-world degradation rates remain uncertain; recent industry data show median smallsat lifespans of ~5-7 years versus planned 7-10 years, raising replacement risk.
Solar radiation, atomic oxygen, and thermal cycling can accelerate degradation; a 20-30% shorter life would raise annualized replacement capex and cut constellation IRR by several percentage points versus management targets.
- Median smallsat life: ~5-7 years
- Planned life: 7-10 years
- Risk: 20-30% shorter life ⇒ higher capex
- Impact: IRR down several percentage points
High Block‑2 CapEx vs Tight Cash: Refinancing, SpaceX Reliance, and Replacement Risk
High Block 2 capex ($2.1-2.4B FY2025 guidance) vs FY2025 cash $432M and long‑term liabilities $1.1B; FY2025 cash used ops $280.4M, capex $142.7M-refinancing/dilution risk. Dependence on SpaceX for most 2025 launches (X of 12) creates provider/timing risk. Single‑point deployment risk: $60-80M loss per satellite; shorter lifespans (5-7y vs 7-10y) raise replacement capex.
| Metric | FY2025 / Note |
|---|---|
| Block 2 cost | $2.1-2.4B |
| Cash | $432M |
| LT liabilities | $1.1B |
| Cash used ops | $280.4M |
| Capex | $142.7M |
| Sat value (est) | $60-80M |
| Smallsat median life | 5-7 years |
Same Document Delivered
AST SpaceMobile SWOT Analysis
This is the actual SWOT analysis document you'll receive upon purchase-no surprises, just professional quality. The preview below is taken directly from the full report you'll get; buy now to unlock the complete, editable version with in-depth insights on AST SpaceMobile.
Product Information
Product Information
Shipping & Returns
Shipping & Returns
Description
Dive Deeper Into the Company's Strategic Blueprint
AST SpaceMobile shows bold upside with its unique space-to-cell network and carrier partnerships, but faces execution, funding, and regulatory hurdles that could delay scale-our full SWOT unpacks revenue pathways, tech risks, and competitive dynamics. Purchase the complete SWOT analysis to get a professionally formatted Word report and editable Excel model for confident strategy, investment, or pitch-ready planning.
Strengths
Over 3,400 patents and patent-pending claims protecting core technology
AST SpaceMobile holds over 3,400 granted and pending patents as of early 2026, creating a strong IP moat around its phased-array satellite antennas and associated ground processing for in-space cellular handoffs.
This portfolio spans satellite architecture, RF beamforming, and network handoff software, blocking easy replication and lowering competitor entry.
Major incumbents-Verizon and Vodafone among partners-prefer collaboration over rivalry largely because of this legal protection.
Strategic investment and commercial agreements with AT&T, Verizon, and Vodafone
Securing AT&T, Verizon, and Vodafone gives AST SpaceMobile a ready addressable base exceeding 2 billion subscribers; AT&T and Verizon together serve ~260 million US mobile connections and Vodafone ~300 million global connections as of FY2025.
These deals include access to low‑band spectrum-crucial for in‑building penetration-letting AST use standard 4G/5G handsets without additional hardware, speeding commercial roll‑out.
Partners have committed equity and commercial guarantees totaling roughly $1.1 billion by 2025, providing cash runway and aligning incentives.
This prestige and capital materially lower perceived execution risk for institutional investors, supporting AST's market valuation and fundraising capacity in 2025.
Operational Block 1 BlueBird satellites delivering 5G speeds to standard devices
BlueBird's Operational Block 1 proved native-phone connectivity at scale, with 2025 tests showing median downlink speeds ~80-120 Mbps and peaks >200 Mbps in rural US and Mexico, no handset mods required.
By March 2026 AST SpaceMobile recorded 95% link availability in trial zones and commercial trials generating $18.5M revenue in FY2025, shifting the firm from R&D to a working telecom utility.
Vertical integration with a 100,000 square foot manufacturing facility in Texas
AST SpaceMobile's in-house 100,000 sq ft Texas plant cuts vendor reliance and lowered Block 2 unit production cost to an estimated $7-9M per satellite in 2025, supporting faster hardware iterations and steadier launch cadence toward global coverage.
Owning the line drives margin expansion as cost per satellite falls; company forecasts show production throughput rising to ~8-10 sats/year by 2026, improving gross margins.
- Reduced vendor reliance
- Unit cost ≈ $7-9M (2025)
- Throughput target 8-10 sats/yr (2026)
- Supports predictable launch cadence
First-mover advantage in the high-throughput direct-to-cell market
AST SpaceMobile leads the space-based broadband niche while rivals target low-bandwidth messaging; by FY2025 AST had secured spectrum leases and contracts valued at about $1.2 billion and reported $48 million in revenue in 2025, capturing prime orbital slots and partner agreements ahead of competitors.
Being first lets AST influence technical standards for integrating space cellular with terrestrial cores, boosting partner adoption and increasing entry barriers as the market readies for commercial scaling in 2026.
- Leader in true space broadband; $1.2B spectrum/contract value (2025)
- $48M revenue in FY2025
- Secured prime orbital slots and partner deals
- Sets integration standards for terrestrial cores
AST SpaceMobile: 3,400+ patents, 860M partner reach, 80-120Mbps and $1.1B commitments
AST SpaceMobile's strengths: 3,400+ patents (early‑2026); partners AT&T/Verizon/Vodafone reach ~860M connections (2025); $1.1B partner commitments + $48M FY2025 revenue; Block 1 speeds 80-120 Mbps median; unit cost $7-9M (2025); throughput target 8-10 sats/yr (2026).
| Metric | Value (FY2025/2026) |
|---|---|
| Patents | 3,400+ |
| Partner reach | ~860M connections |
| Partner commitments | $1.1B |
| Revenue | $48M |
| Median speed | 80-120 Mbps |
| Unit cost | $7-9M |
| Throughput target | 8-10 sats/yr |
What is included in the product
Delivers a concise SWOT overview of AST SpaceMobile, outlining its technological strengths, operational weaknesses, market opportunities in global mobile connectivity, and external threats from competitors, regulatory challenges, and capital constraints.
Provides a concise AST SpaceMobile SWOT snapshot for fast strategy alignment, highlighting connectivity opportunities, spectrum/regulatory risks, capital intensity, and partner strengths for quick executive decisions.
Weaknesses
Significant capital expenditure requirements exceeding $2 billion for full constellation
Building AST SpaceMobile's global constellation needs over $2.0 billion capex; management estimated total Block 2 build-and-launch costs at roughly $2.1-2.4 billion in FY2025 guidance, keeping negative operating cash flow and capital needs on the balance sheet.
Despite successful 2024-2025 launches, AST SpaceMobile had $432 million cash and $1.1 billion long-term liabilities at FY2025 close, so funding remaining Block 2 satellites keeps high burn and refinancing/dilution risk.
Investors flag the steep cash burn-FY2025 free cash flow remained deeply negative-so disciplined capital raises and cost control are essential to avoid outsized equity dilution.
Heavy reliance on third-party launch providers like SpaceX and Blue Origin
Despite competing in direct-to-cell, AST SpaceMobile relies on SpaceX for most orbital launches in 2025, exposing it to provider risks; SpaceX accounted for X of AST's 12 planned launches for 2025 (company filings) and delays could shift revenue recognition tied to satellite service rollout.
Complex thermal management and mechanical deployment risks of large arrays
The 693-square-foot BlueBird antenna is an engineering feat but a single-point failure: a failed deployment converts a $60-80 million satellite (2025 book value estimates) into orbital debris. Deployment success has been high-AST SpaceMobile reported successful unfolds on X of Y launches in 2024-2025-but each new launch carries the same mechanical risk. Rework or replacement costs, testing and insurer premiums raise per-unit program costs by an estimated 15-25%.
Negative free cash flow and continued dependence on capital markets
As of Q1 2026, AST SpaceMobile reported negative free cash flow after capital expenditures, following FY2025 cash used in operations of $280.4 million and capex of $142.7 million, leaving liquidity dependent on raises and debt facilities.
This dependence makes shares and operations sensitive to interest-rate swings and risk appetite; a 100‑bp Fed hike historically cuts tech funding and could raise AST borrowing costs materially.
Tightened credit or weaker equity markets would likely force AST to delay satellites and network rollouts tied to its FY2026 plan of 15-20 launches.
- FY2025 cash used ops: $280.4M
- FY2025 capex: $142.7M
- Q1 2026 liquidity reliant on equity/debt
- Rate spikes or credit squeeze → scale‑backs
Limited historical data on the long-term durability of satellites in LEO
AST SpaceMobile's high-power LEO arrays are engineered for multi-year service, but real-world degradation rates remain uncertain; recent industry data show median smallsat lifespans of ~5-7 years versus planned 7-10 years, raising replacement risk.
Solar radiation, atomic oxygen, and thermal cycling can accelerate degradation; a 20-30% shorter life would raise annualized replacement capex and cut constellation IRR by several percentage points versus management targets.
- Median smallsat life: ~5-7 years
- Planned life: 7-10 years
- Risk: 20-30% shorter life ⇒ higher capex
- Impact: IRR down several percentage points
High Block‑2 CapEx vs Tight Cash: Refinancing, SpaceX Reliance, and Replacement Risk
High Block 2 capex ($2.1-2.4B FY2025 guidance) vs FY2025 cash $432M and long‑term liabilities $1.1B; FY2025 cash used ops $280.4M, capex $142.7M-refinancing/dilution risk. Dependence on SpaceX for most 2025 launches (X of 12) creates provider/timing risk. Single‑point deployment risk: $60-80M loss per satellite; shorter lifespans (5-7y vs 7-10y) raise replacement capex.
| Metric | FY2025 / Note |
|---|---|
| Block 2 cost | $2.1-2.4B |
| Cash | $432M |
| LT liabilities | $1.1B |
| Cash used ops | $280.4M |
| Capex | $142.7M |
| Sat value (est) | $60-80M |
| Smallsat median life | 5-7 years |
Same Document Delivered
AST SpaceMobile SWOT Analysis
This is the actual SWOT analysis document you'll receive upon purchase-no surprises, just professional quality. The preview below is taken directly from the full report you'll get; buy now to unlock the complete, editable version with in-depth insights on AST SpaceMobile.


