BOOMERANG PORTER'S FIVE FORCES TEMPLATE RESEARCH
What is included in the product
Analyzes Boomerang's competitive environment, highlighting threats & opportunities.
Quickly analyze all five forces, so you can spend less time on analysis and more on strategy.
What You See Is What You Get
Boomerang Porter's Five Forces Analysis
This preview showcases the complete Porter's Five Forces analysis for Boomerang. The document you're currently viewing mirrors the final product. It's ready for immediate download and use after your purchase is complete.

Porter's Five Forces Analysis Template
Don't Miss the Bigger Picture
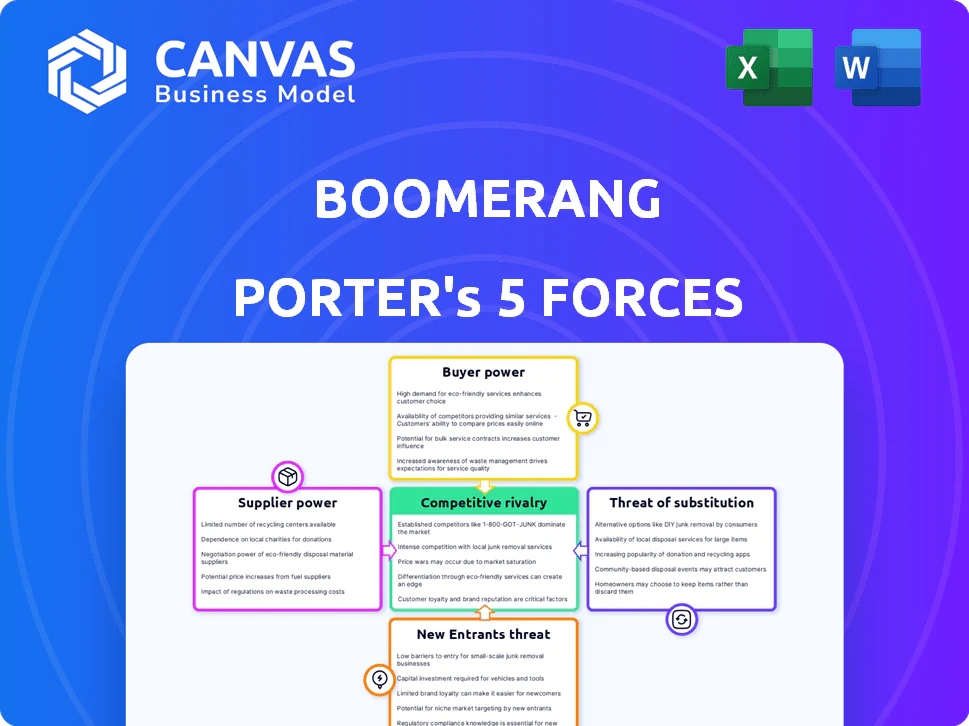
Boomerang's competitive landscape hinges on the interplay of five key forces. The bargaining power of buyers, and suppliers, along with the threat of new entrants, substitutes, and rivalry, shape its market position. These forces influence profitability and strategic choices.
This brief snapshot only scratches the surface. Unlock the full Porter's Five Forces Analysis to explore Boomerang’s competitive dynamics, market pressures, and strategic advantages in detail.
Suppliers Bargaining Power
Technology Providers
Boomerang's tech needs impact supplier power. Website platforms and software are key. If tech is unique, suppliers gain power. Switching costs also matter. For example, in 2024, cloud service spending rose 20% yearly.
Shipping and Logistics Companies
Boomerang's service relies heavily on shipping. The bargaining power of shipping companies depends on Boomerang's shipment volume and carrier alternatives. In 2024, the global logistics market was valued at $10.6 trillion. More volume and options lower supplier power. For instance, FedEx and UPS control a large market share.

Storage Facilities
Storing lost items necessitates physical space, making storage facilities crucial for Boomerang. The bargaining power of storage providers hinges on storage availability in key areas, relocation costs, and Boomerang's space needs. In 2024, commercial real estate costs varied significantly; prime locations could command $50+ per square foot annually. Relocating stored items might incur substantial logistical expenses, potentially increasing the bargaining power of storage providers, especially in space-constrained urban environments. Boomerang's volume requirements also influence this dynamic.
Payment Gateway Providers
Payment gateway providers are crucial for processing returns. Their bargaining power hinges on transaction fees, which can range from 1.5% to 3.5% per transaction, impacting profitability. Switching providers can be complex, affecting negotiation leverage. The services offered, such as fraud protection and currency conversion, also influence their power.
- Transaction fees impact profitability directly.
- Switching costs can limit negotiation power.
- Service offerings add to the provider's strength.
- Market competition influences pricing.
Marketing and Advertising Channels
Boomerang's marketing and advertising channels significantly impact its supplier power. The cost and effectiveness of these channels, such as social media or search engine marketing, vary. Boomerang's dependence on specific platforms for user acquisition, like Google or Meta, influences supplier power.
- Ad spending on social media in 2024 is projected to reach $226.4 billion globally.
- Google Ads accounted for approximately 28% of global digital ad spending in 2023.
- Meta's ad revenue in Q3 2023 was $34.15 billion.
- The average cost per click (CPC) on Google Ads can range from $1 to $5.
Supplier Power Dynamics: A Breakdown
Supplier power varies across Boomerang's operations. Tech suppliers gain power if their offerings are unique. Shipping, storage, and payment providers also wield influence. Marketing channels like Google and Meta impact supplier dynamics.
| Supplier Type | Factors Influencing Power | 2024 Data/Examples |
|---|---|---|
| Tech | Uniqueness, switching costs | Cloud spending +20% YoY |
| Shipping | Volume, alternatives | Global logistics: $10.6T |
| Storage | Availability, relocation costs | Prime real estate: $50+/sq ft |
| Payment Gateways | Fees, switching costs, services | Fees: 1.5%-3.5% per transaction |
| Marketing | Cost, platform dependence | Social media ad spend: $226.4B |
Customers Bargaining Power
Individuals Reporting Lost Items
Individuals seeking lost items possess moderate bargaining power. Their need to recover valuables is high, but the individual transaction value is often low. Alternatives like social media or local listings offer some leverage. In 2024, approximately 60% of lost items were recovered through various methods, indicating competition.
Individuals Claiming Found Items
Individuals who claim found items impact Boomerang Porter's revenue. Their bargaining power hinges on return costs and ease. If shipping is expensive, usage declines; in 2024, shipping costs rose 5-7% due to fuel prices. Emotional value also influences their choices. Consider that 60% of people value lost items highly.

Businesses (e.g., transportation, hospitality)
Businesses partnering with Boomerang, like transportation or hospitality, wield significant bargaining power, particularly if they manage substantial lost item volumes. They can negotiate service terms, pricing, and system integration. The availability of alternative lost and found solutions also impacts their leverage. For instance, in 2024, the global market for lost and found services was valued at approximately $1.5 billion, with expected growth. This market size allows businesses to explore various options.
Ability to Self-Serve
Customers can attempt to find lost items independently, which affects their bargaining power. This includes contacting venues or using social media, offering alternatives to Boomerang's services. The effectiveness of these self-service options influences the demand for Boomerang's solutions. As of 2024, about 30% of lost items are recovered through direct customer efforts before involving a service.
- Self-recovery success rates vary, impacting service demand.
- Direct venue contact can bypass Boomerang's services.
- Social media offers an alternative for item recovery.
- Customer's willingness to pay depends on self-service effectiveness.
Availability of Information
If customers can quickly find and compare prices for lost and found services, their power grows. This happens when information is easy to access. For example, online platforms allow users to assess different services. This transparency boosts their ability to negotiate terms.
- Price comparison websites and apps are used by around 60% of online shoppers, highlighting the importance of readily available information.
- Studies show that consumers who compare prices are more likely to switch providers, increasing competition.
- The average consumer spends about 20 minutes comparing prices before making a purchase decision.
Customer Bargaining Power: A 2024 Analysis
Customers' bargaining power varies based on their ability to find items independently. Alternatives like contacting venues or using social media provide leverage. Price transparency via online platforms also strengthens their position. In 2024, about 30% of items were found directly by customers, impacting service demand.
| Customer Type | Bargaining Power | Influencing Factors |
|---|---|---|
| Lost Item Seekers | Moderate | Recovery need, transaction value, alternatives. |
| Found Item Claimers | Variable | Return costs, ease, emotional value. |
| Businesses Partners | High | Lost item volume, alternatives. |
Rivalry Among Competitors
Number and Size of Competitors
Competitive rivalry in the lost and found services market is influenced by the number and size of competitors. A fragmented market, with numerous smaller players, tends to heighten rivalry. For example, there are over 100 lost and found businesses in the United States. This fragmentation leads to increased competition.
Differentiation of Services
If Boomerang Porter's competitors offer distinct services, such as specialized logistics or unique customer support, rivalry could be less fierce. Conversely, if services are similar, like basic moving without extra features, the competition will be more price-driven. For instance, in 2024, companies offering value-added services saw profit margins increase by 10% compared to those offering only standard services.

Switching Costs for Customers
Low switching costs heighten competitive rivalry in the lost and found market. For instance, a 2024 survey indicated that 70% of users would switch services for better features. Easy transitions mean businesses must constantly innovate. This pressure intensifies competition, requiring continuous improvements to retain users. A 2024 study showed that companies with higher switching costs had 15% better customer retention.
Industry Growth Rate
Industry growth significantly impacts competitive rivalry. Slow growth intensifies competition as companies fight for limited market share. Conversely, rapid growth can reduce rivalry by allowing multiple players to thrive. For instance, the U.S. GDP grew by 3.1% in Q4 2023, indicating moderate growth. This moderate growth suggests a balanced level of rivalry across various sectors.
- Slow growth: Higher rivalry, intense competition for market share.
- Rapid growth: Lower rivalry, more room for competitors to succeed.
- U.S. GDP Q4 2023: 3.1% growth, indicating moderate rivalry.
- Market dynamics: Growth rates directly affect competitive behaviors.
Exit Barriers
High exit barriers intensify rivalry. Companies remain, even when unprofitable. This boosts competition, as seen in the airline industry. For example, in 2024, several airlines faced financial struggles. They continued operating due to high costs like aircraft leases.
- Exit barriers include asset specificity, such as specialized equipment.
- High exit costs keep firms competing, lowering profitability.
- Government or social barriers also keep firms competing.
- These barriers lead to intense price wars and innovation.
Rivalry Dynamics: Market, Service, and Costs
Competitive rivalry is shaped by market fragmentation. Boomerang Porter's competition depends on service differentiation and switching costs. Industry growth and exit barriers also influence competition intensity.
| Factor | Impact | Example (2024 Data) |
|---|---|---|
| Market Fragmentation | More competitors intensify rivalry | Over 100 lost and found businesses in the U.S. |
| Service Differentiation | Unique services reduce price-based competition | Value-added services saw 10% profit margin increase. |
| Switching Costs | Low costs increase rivalry; high costs decrease | 70% of users would switch for better features. |
BOOMERANG PORTER'S FIVE FORCES TEMPLATE RESEARCH
What is included in the product
Analyzes Boomerang's competitive environment, highlighting threats & opportunities.
Quickly analyze all five forces, so you can spend less time on analysis and more on strategy.
What You See Is What You Get
Boomerang Porter's Five Forces Analysis
This preview showcases the complete Porter's Five Forces analysis for Boomerang. The document you're currently viewing mirrors the final product. It's ready for immediate download and use after your purchase is complete.
Porter's Five Forces Analysis Template
Don't Miss the Bigger Picture
Boomerang's competitive landscape hinges on the interplay of five key forces. The bargaining power of buyers, and suppliers, along with the threat of new entrants, substitutes, and rivalry, shape its market position. These forces influence profitability and strategic choices.
This brief snapshot only scratches the surface. Unlock the full Porter's Five Forces Analysis to explore Boomerang’s competitive dynamics, market pressures, and strategic advantages in detail.
Suppliers Bargaining Power
Technology Providers
Boomerang's tech needs impact supplier power. Website platforms and software are key. If tech is unique, suppliers gain power. Switching costs also matter. For example, in 2024, cloud service spending rose 20% yearly.
Shipping and Logistics Companies
Boomerang's service relies heavily on shipping. The bargaining power of shipping companies depends on Boomerang's shipment volume and carrier alternatives. In 2024, the global logistics market was valued at $10.6 trillion. More volume and options lower supplier power. For instance, FedEx and UPS control a large market share.
Storage Facilities
Storing lost items necessitates physical space, making storage facilities crucial for Boomerang. The bargaining power of storage providers hinges on storage availability in key areas, relocation costs, and Boomerang's space needs. In 2024, commercial real estate costs varied significantly; prime locations could command $50+ per square foot annually. Relocating stored items might incur substantial logistical expenses, potentially increasing the bargaining power of storage providers, especially in space-constrained urban environments. Boomerang's volume requirements also influence this dynamic.
Payment Gateway Providers
Payment gateway providers are crucial for processing returns. Their bargaining power hinges on transaction fees, which can range from 1.5% to 3.5% per transaction, impacting profitability. Switching providers can be complex, affecting negotiation leverage. The services offered, such as fraud protection and currency conversion, also influence their power.
- Transaction fees impact profitability directly.
- Switching costs can limit negotiation power.
- Service offerings add to the provider's strength.
- Market competition influences pricing.
Marketing and Advertising Channels
Boomerang's marketing and advertising channels significantly impact its supplier power. The cost and effectiveness of these channels, such as social media or search engine marketing, vary. Boomerang's dependence on specific platforms for user acquisition, like Google or Meta, influences supplier power.
- Ad spending on social media in 2024 is projected to reach $226.4 billion globally.
- Google Ads accounted for approximately 28% of global digital ad spending in 2023.
- Meta's ad revenue in Q3 2023 was $34.15 billion.
- The average cost per click (CPC) on Google Ads can range from $1 to $5.
Supplier Power Dynamics: A Breakdown
Supplier power varies across Boomerang's operations. Tech suppliers gain power if their offerings are unique. Shipping, storage, and payment providers also wield influence. Marketing channels like Google and Meta impact supplier dynamics.
| Supplier Type | Factors Influencing Power | 2024 Data/Examples |
|---|---|---|
| Tech | Uniqueness, switching costs | Cloud spending +20% YoY |
| Shipping | Volume, alternatives | Global logistics: $10.6T |
| Storage | Availability, relocation costs | Prime real estate: $50+/sq ft |
| Payment Gateways | Fees, switching costs, services | Fees: 1.5%-3.5% per transaction |
| Marketing | Cost, platform dependence | Social media ad spend: $226.4B |
Customers Bargaining Power
Individuals Reporting Lost Items
Individuals seeking lost items possess moderate bargaining power. Their need to recover valuables is high, but the individual transaction value is often low. Alternatives like social media or local listings offer some leverage. In 2024, approximately 60% of lost items were recovered through various methods, indicating competition.
Individuals Claiming Found Items
Individuals who claim found items impact Boomerang Porter's revenue. Their bargaining power hinges on return costs and ease. If shipping is expensive, usage declines; in 2024, shipping costs rose 5-7% due to fuel prices. Emotional value also influences their choices. Consider that 60% of people value lost items highly.
Businesses (e.g., transportation, hospitality)
Businesses partnering with Boomerang, like transportation or hospitality, wield significant bargaining power, particularly if they manage substantial lost item volumes. They can negotiate service terms, pricing, and system integration. The availability of alternative lost and found solutions also impacts their leverage. For instance, in 2024, the global market for lost and found services was valued at approximately $1.5 billion, with expected growth. This market size allows businesses to explore various options.
Ability to Self-Serve
Customers can attempt to find lost items independently, which affects their bargaining power. This includes contacting venues or using social media, offering alternatives to Boomerang's services. The effectiveness of these self-service options influences the demand for Boomerang's solutions. As of 2024, about 30% of lost items are recovered through direct customer efforts before involving a service.
- Self-recovery success rates vary, impacting service demand.
- Direct venue contact can bypass Boomerang's services.
- Social media offers an alternative for item recovery.
- Customer's willingness to pay depends on self-service effectiveness.
Availability of Information
If customers can quickly find and compare prices for lost and found services, their power grows. This happens when information is easy to access. For example, online platforms allow users to assess different services. This transparency boosts their ability to negotiate terms.
- Price comparison websites and apps are used by around 60% of online shoppers, highlighting the importance of readily available information.
- Studies show that consumers who compare prices are more likely to switch providers, increasing competition.
- The average consumer spends about 20 minutes comparing prices before making a purchase decision.
Customer Bargaining Power: A 2024 Analysis
Customers' bargaining power varies based on their ability to find items independently. Alternatives like contacting venues or using social media provide leverage. Price transparency via online platforms also strengthens their position. In 2024, about 30% of items were found directly by customers, impacting service demand.
| Customer Type | Bargaining Power | Influencing Factors |
|---|---|---|
| Lost Item Seekers | Moderate | Recovery need, transaction value, alternatives. |
| Found Item Claimers | Variable | Return costs, ease, emotional value. |
| Businesses Partners | High | Lost item volume, alternatives. |
Rivalry Among Competitors
Number and Size of Competitors
Competitive rivalry in the lost and found services market is influenced by the number and size of competitors. A fragmented market, with numerous smaller players, tends to heighten rivalry. For example, there are over 100 lost and found businesses in the United States. This fragmentation leads to increased competition.
Differentiation of Services
If Boomerang Porter's competitors offer distinct services, such as specialized logistics or unique customer support, rivalry could be less fierce. Conversely, if services are similar, like basic moving without extra features, the competition will be more price-driven. For instance, in 2024, companies offering value-added services saw profit margins increase by 10% compared to those offering only standard services.
Switching Costs for Customers
Low switching costs heighten competitive rivalry in the lost and found market. For instance, a 2024 survey indicated that 70% of users would switch services for better features. Easy transitions mean businesses must constantly innovate. This pressure intensifies competition, requiring continuous improvements to retain users. A 2024 study showed that companies with higher switching costs had 15% better customer retention.
Industry Growth Rate
Industry growth significantly impacts competitive rivalry. Slow growth intensifies competition as companies fight for limited market share. Conversely, rapid growth can reduce rivalry by allowing multiple players to thrive. For instance, the U.S. GDP grew by 3.1% in Q4 2023, indicating moderate growth. This moderate growth suggests a balanced level of rivalry across various sectors.
- Slow growth: Higher rivalry, intense competition for market share.
- Rapid growth: Lower rivalry, more room for competitors to succeed.
- U.S. GDP Q4 2023: 3.1% growth, indicating moderate rivalry.
- Market dynamics: Growth rates directly affect competitive behaviors.
Exit Barriers
High exit barriers intensify rivalry. Companies remain, even when unprofitable. This boosts competition, as seen in the airline industry. For example, in 2024, several airlines faced financial struggles. They continued operating due to high costs like aircraft leases.
- Exit barriers include asset specificity, such as specialized equipment.
- High exit costs keep firms competing, lowering profitability.
- Government or social barriers also keep firms competing.
- These barriers lead to intense price wars and innovation.
Rivalry Dynamics: Market, Service, and Costs
Competitive rivalry is shaped by market fragmentation. Boomerang Porter's competition depends on service differentiation and switching costs. Industry growth and exit barriers also influence competition intensity.
| Factor | Impact | Example (2024 Data) |
|---|---|---|
| Market Fragmentation | More competitors intensify rivalry | Over 100 lost and found businesses in the U.S. |
| Service Differentiation | Unique services reduce price-based competition | Value-added services saw 10% profit margin increase. |
| Switching Costs | Low costs increase rivalry; high costs decrease | 70% of users would switch for better features. |
Product Information
Product Information
Shipping & Returns
Shipping & Returns
Description
What is included in the product
Analyzes Boomerang's competitive environment, highlighting threats & opportunities.
Quickly analyze all five forces, so you can spend less time on analysis and more on strategy.
What You See Is What You Get
Boomerang Porter's Five Forces Analysis
This preview showcases the complete Porter's Five Forces analysis for Boomerang. The document you're currently viewing mirrors the final product. It's ready for immediate download and use after your purchase is complete.
Porter's Five Forces Analysis Template
Don't Miss the Bigger Picture
Boomerang's competitive landscape hinges on the interplay of five key forces. The bargaining power of buyers, and suppliers, along with the threat of new entrants, substitutes, and rivalry, shape its market position. These forces influence profitability and strategic choices.
This brief snapshot only scratches the surface. Unlock the full Porter's Five Forces Analysis to explore Boomerang’s competitive dynamics, market pressures, and strategic advantages in detail.
Suppliers Bargaining Power
Technology Providers
Boomerang's tech needs impact supplier power. Website platforms and software are key. If tech is unique, suppliers gain power. Switching costs also matter. For example, in 2024, cloud service spending rose 20% yearly.
Shipping and Logistics Companies
Boomerang's service relies heavily on shipping. The bargaining power of shipping companies depends on Boomerang's shipment volume and carrier alternatives. In 2024, the global logistics market was valued at $10.6 trillion. More volume and options lower supplier power. For instance, FedEx and UPS control a large market share.
Storage Facilities
Storing lost items necessitates physical space, making storage facilities crucial for Boomerang. The bargaining power of storage providers hinges on storage availability in key areas, relocation costs, and Boomerang's space needs. In 2024, commercial real estate costs varied significantly; prime locations could command $50+ per square foot annually. Relocating stored items might incur substantial logistical expenses, potentially increasing the bargaining power of storage providers, especially in space-constrained urban environments. Boomerang's volume requirements also influence this dynamic.
Payment Gateway Providers
Payment gateway providers are crucial for processing returns. Their bargaining power hinges on transaction fees, which can range from 1.5% to 3.5% per transaction, impacting profitability. Switching providers can be complex, affecting negotiation leverage. The services offered, such as fraud protection and currency conversion, also influence their power.
- Transaction fees impact profitability directly.
- Switching costs can limit negotiation power.
- Service offerings add to the provider's strength.
- Market competition influences pricing.
Marketing and Advertising Channels
Boomerang's marketing and advertising channels significantly impact its supplier power. The cost and effectiveness of these channels, such as social media or search engine marketing, vary. Boomerang's dependence on specific platforms for user acquisition, like Google or Meta, influences supplier power.
- Ad spending on social media in 2024 is projected to reach $226.4 billion globally.
- Google Ads accounted for approximately 28% of global digital ad spending in 2023.
- Meta's ad revenue in Q3 2023 was $34.15 billion.
- The average cost per click (CPC) on Google Ads can range from $1 to $5.
Supplier Power Dynamics: A Breakdown
Supplier power varies across Boomerang's operations. Tech suppliers gain power if their offerings are unique. Shipping, storage, and payment providers also wield influence. Marketing channels like Google and Meta impact supplier dynamics.
| Supplier Type | Factors Influencing Power | 2024 Data/Examples |
|---|---|---|
| Tech | Uniqueness, switching costs | Cloud spending +20% YoY |
| Shipping | Volume, alternatives | Global logistics: $10.6T |
| Storage | Availability, relocation costs | Prime real estate: $50+/sq ft |
| Payment Gateways | Fees, switching costs, services | Fees: 1.5%-3.5% per transaction |
| Marketing | Cost, platform dependence | Social media ad spend: $226.4B |
Customers Bargaining Power
Individuals Reporting Lost Items
Individuals seeking lost items possess moderate bargaining power. Their need to recover valuables is high, but the individual transaction value is often low. Alternatives like social media or local listings offer some leverage. In 2024, approximately 60% of lost items were recovered through various methods, indicating competition.
Individuals Claiming Found Items
Individuals who claim found items impact Boomerang Porter's revenue. Their bargaining power hinges on return costs and ease. If shipping is expensive, usage declines; in 2024, shipping costs rose 5-7% due to fuel prices. Emotional value also influences their choices. Consider that 60% of people value lost items highly.
Businesses (e.g., transportation, hospitality)
Businesses partnering with Boomerang, like transportation or hospitality, wield significant bargaining power, particularly if they manage substantial lost item volumes. They can negotiate service terms, pricing, and system integration. The availability of alternative lost and found solutions also impacts their leverage. For instance, in 2024, the global market for lost and found services was valued at approximately $1.5 billion, with expected growth. This market size allows businesses to explore various options.
Ability to Self-Serve
Customers can attempt to find lost items independently, which affects their bargaining power. This includes contacting venues or using social media, offering alternatives to Boomerang's services. The effectiveness of these self-service options influences the demand for Boomerang's solutions. As of 2024, about 30% of lost items are recovered through direct customer efforts before involving a service.
- Self-recovery success rates vary, impacting service demand.
- Direct venue contact can bypass Boomerang's services.
- Social media offers an alternative for item recovery.
- Customer's willingness to pay depends on self-service effectiveness.
Availability of Information
If customers can quickly find and compare prices for lost and found services, their power grows. This happens when information is easy to access. For example, online platforms allow users to assess different services. This transparency boosts their ability to negotiate terms.
- Price comparison websites and apps are used by around 60% of online shoppers, highlighting the importance of readily available information.
- Studies show that consumers who compare prices are more likely to switch providers, increasing competition.
- The average consumer spends about 20 minutes comparing prices before making a purchase decision.
Customer Bargaining Power: A 2024 Analysis
Customers' bargaining power varies based on their ability to find items independently. Alternatives like contacting venues or using social media provide leverage. Price transparency via online platforms also strengthens their position. In 2024, about 30% of items were found directly by customers, impacting service demand.
| Customer Type | Bargaining Power | Influencing Factors |
|---|---|---|
| Lost Item Seekers | Moderate | Recovery need, transaction value, alternatives. |
| Found Item Claimers | Variable | Return costs, ease, emotional value. |
| Businesses Partners | High | Lost item volume, alternatives. |
Rivalry Among Competitors
Number and Size of Competitors
Competitive rivalry in the lost and found services market is influenced by the number and size of competitors. A fragmented market, with numerous smaller players, tends to heighten rivalry. For example, there are over 100 lost and found businesses in the United States. This fragmentation leads to increased competition.
Differentiation of Services
If Boomerang Porter's competitors offer distinct services, such as specialized logistics or unique customer support, rivalry could be less fierce. Conversely, if services are similar, like basic moving without extra features, the competition will be more price-driven. For instance, in 2024, companies offering value-added services saw profit margins increase by 10% compared to those offering only standard services.
Switching Costs for Customers
Low switching costs heighten competitive rivalry in the lost and found market. For instance, a 2024 survey indicated that 70% of users would switch services for better features. Easy transitions mean businesses must constantly innovate. This pressure intensifies competition, requiring continuous improvements to retain users. A 2024 study showed that companies with higher switching costs had 15% better customer retention.
Industry Growth Rate
Industry growth significantly impacts competitive rivalry. Slow growth intensifies competition as companies fight for limited market share. Conversely, rapid growth can reduce rivalry by allowing multiple players to thrive. For instance, the U.S. GDP grew by 3.1% in Q4 2023, indicating moderate growth. This moderate growth suggests a balanced level of rivalry across various sectors.
- Slow growth: Higher rivalry, intense competition for market share.
- Rapid growth: Lower rivalry, more room for competitors to succeed.
- U.S. GDP Q4 2023: 3.1% growth, indicating moderate rivalry.
- Market dynamics: Growth rates directly affect competitive behaviors.
Exit Barriers
High exit barriers intensify rivalry. Companies remain, even when unprofitable. This boosts competition, as seen in the airline industry. For example, in 2024, several airlines faced financial struggles. They continued operating due to high costs like aircraft leases.
- Exit barriers include asset specificity, such as specialized equipment.
- High exit costs keep firms competing, lowering profitability.
- Government or social barriers also keep firms competing.
- These barriers lead to intense price wars and innovation.
Rivalry Dynamics: Market, Service, and Costs
Competitive rivalry is shaped by market fragmentation. Boomerang Porter's competition depends on service differentiation and switching costs. Industry growth and exit barriers also influence competition intensity.
| Factor | Impact | Example (2024 Data) |
|---|---|---|
| Market Fragmentation | More competitors intensify rivalry | Over 100 lost and found businesses in the U.S. |
| Service Differentiation | Unique services reduce price-based competition | Value-added services saw 10% profit margin increase. |
| Switching Costs | Low costs increase rivalry; high costs decrease | 70% of users would switch for better features. |


