CART.COM PORTER'S FIVE FORCES TEMPLATE RESEARCH
What is included in the product
Evaluates control held by suppliers and buyers, and their influence on pricing and profitability.
Duplicate tabs allow comparing the Porter's Five Forces under varied scenarios for better strategic planning.
Same Document Delivered
Cart.com Porter's Five Forces Analysis
This preview showcases the exact Cart.com Porter's Five Forces analysis you'll receive upon purchase. It's a complete, ready-to-use document, professionally formatted. The insights displayed here are the same you'll get access to instantly after buying.

Porter's Five Forces Analysis Template
Don't Miss the Bigger Picture
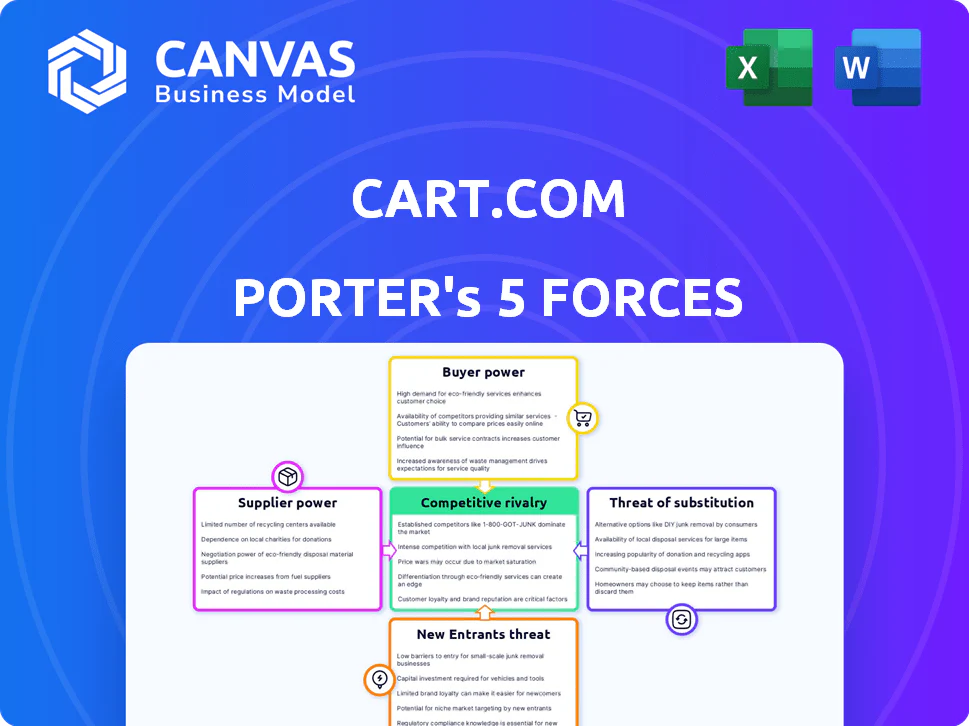
Cart.com navigates a dynamic e-commerce landscape, where competition is fierce. Buyer power, driven by consumer choice, significantly impacts pricing strategies. The threat of new entrants, particularly from established tech players, looms large. Analyze supplier leverage and the presence of substitute services to truly grasp Cart.com's competitive position.
Our full Porter's Five Forces report goes deeper—offering a data-driven framework to understand Cart.com's real business risks and market opportunities.
Suppliers Bargaining Power
Dependence on Technology Providers
Cart.com's dependence on technology is significant, as its e-commerce platform and services are tech-driven. This reliance gives technology providers leverage, impacting Cart.com's costs and innovation capabilities. The need for specific software and cloud infrastructure, such as AWS, further strengthens their position. In 2024, the global cloud computing market was valued at over $670 billion, showcasing the tech providers' substantial influence.
Access to Fulfillment Infrastructure
Cart.com's fulfillment capabilities rely on suppliers of warehouse space, automation, and transportation. In 2024, warehouse lease rates in key US markets rose, potentially increasing Cart.com's costs. Automation technology costs also fluctuated, with some solutions increasing by up to 7%. Transportation expenses, including fuel and labor, also affected costs. These factors can influence Cart.com's service pricing.

Labor Market Conditions
Cart.com's supplier power is influenced by labor market conditions. The availability and cost of skilled labor, crucial for logistics and tech, directly affect operations. In 2024, the logistics sector faced a 5.8% increase in labor costs. Tight labor markets can lead to higher wage demands, impacting service quality and profitability. These factors increase supplier power.
Software and Service Providers
Cart.com relies on software and service providers like payment gateways and marketing tools, making it vulnerable to their bargaining power. These providers, including giants like Stripe and Google, can influence Cart.com's costs and operational efficiency through pricing and service terms. For instance, in 2024, the average cost for payment processing services increased by 5-7% due to rising demand and operational expenses. This dependency impacts Cart.com's profitability and flexibility.
- Payment processing fees, a key component, rose by approximately 6% in 2024.
- Marketing tool subscriptions and analytics services also saw price increases.
- Service availability and reliability are crucial for Cart.com's operations.
- Negotiating favorable terms is essential for mitigating supplier power.
Acquisition Strategy and Integration
Cart.com's acquisition strategy, like its purchase of Easyship, has brought crucial tech and services in-house, potentially lessening supplier power. However, this also means relying on smooth integration. In 2024, Cart.com's acquisitions included e-commerce and logistics firms, increasing internal control. Successful integration is key to leveraging these assets effectively.
- Acquisitions of companies with complementary services and technology.
- Bringing capabilities in-house can reduce the bargaining power of external suppliers.
- Successful integration of acquired assets and technologies is crucial.
- Cart.com's 2024 strategy included e-commerce and logistics firm acquisitions.
Supplier Dynamics Shaping E-commerce Costs
Cart.com faces supplier power from tech, fulfillment, and labor markets. Tech providers, like AWS, and payment processors, like Stripe, influence costs. In 2024, payment processing fees rose about 6%. Acquisitions, like Easyship, aim to reduce this power.
| Supplier Type | Impact on Cart.com | 2024 Data |
|---|---|---|
| Tech Providers | Influences costs and innovation | Cloud market over $670B |
| Fulfillment Suppliers | Affects service pricing | Warehouse lease rates up |
| Labor Market | Impacts service quality | Logistics labor costs +5.8% |
Customers Bargaining Power
Availability of Alternatives
Cart.com's customers possess substantial bargaining power due to the abundance of alternatives. They can opt for self-built e-commerce solutions or rival platforms. This competition forces Cart.com to maintain competitive pricing and superior service quality. In 2024, the e-commerce software market size was valued at $7.88 billion, highlighting the plethora of choices available to customers. If Cart.com's offerings falter, customers can readily switch providers.
Customer Concentration
If a handful of major clients contribute heavily to Cart.com's revenue, those clients wield substantial bargaining power. They can push for better deals, pricing, or tailored services, leveraging their significance to Cart.com. For example, if 30% of Cart.com's revenue comes from just three clients, those clients have considerable leverage in negotiations. In 2024, this concentration could lead to reduced profit margins if Cart.com has to concede on pricing to retain them.

Switching Costs
Switching costs significantly impact customer bargaining power. If it's easy to switch, customers have more leverage. Cart.com's integration of various e-commerce functions creates some "stickiness". In 2024, the average cost to migrate platforms ranged from $5,000-$25,000 depending on complexity.
Customer Knowledge and Information
Customers now possess unprecedented access to information, especially regarding e-commerce solutions and their pricing. This shift has significantly amplified their bargaining power, allowing them to negotiate favorable terms and demand greater value. According to Statista, e-commerce sales in the U.S. reached $1.1 trillion in 2023, demonstrating the substantial market influence of informed consumers. This trend puts pressure on platforms like Cart.com to remain competitive.
- Price Comparison: Customers can easily compare prices across different e-commerce platforms.
- Product Reviews: Access to reviews and ratings influences purchasing decisions.
- Negotiation: Customers can negotiate for better deals.
- Switching Costs: Low switching costs enable customers to switch providers easily.
Demand for Integrated Solutions
Cart.com's comprehensive services attract businesses looking for a one-stop e-commerce solution. This integrated approach can reduce customer bargaining power to some extent. In 2024, the e-commerce market saw a significant shift towards bundled services, with platforms like Shopify and BigCommerce offering similar packages. However, the existence of these alternatives still provides customers with options.
- Integrated solutions can reduce customer power.
- Market competition keeps customer options open.
- Shopify and BigCommerce are main competitors.
- Businesses seek one-stop e-commerce solutions.
How Customers Shape the E-Commerce Landscape
Cart.com customers benefit from many choices, including self-built solutions and rival platforms. This boosts their bargaining power, compelling Cart.com to be competitive. In 2024, the e-commerce software market was worth $7.88 billion, offering plenty of options.
Major clients significantly influence Cart.com's revenue and can demand better deals. If a few clients account for a large portion of revenue, they gain leverage. This concentration can pressure profit margins.
Switching costs affect customer power; easy switching gives customers more leverage. Cart.com's integrated services create some "stickiness." The average platform migration cost was $5,000-$25,000 in 2024.
| Factor | Impact on Customer Bargaining Power | 2024 Data/Example |
|---|---|---|
| Market Competition | High; many alternatives | E-commerce software market: $7.88B |
| Client Concentration | High for major clients | If 3 clients = 30% revenue |
| Switching Costs | Low = High Power | Migration cost: $5K-$25K |
Rivalry Among Competitors
Number and Diversity of Competitors
The e-commerce solutions market features numerous competitors, including Shopify, BigCommerce, and Adobe Commerce, alongside specialized providers. This diverse landscape intensifies competition. In 2024, Shopify's revenue reached approximately $7.1 billion, reflecting the intense rivalry for market share.
Market Growth Rate
The e-commerce market's growth is substantial, especially in fulfillment and digital payments. Despite this, competition remains fierce. In 2024, global e-commerce sales reached approximately $6.3 trillion. Companies compete aggressively for market share within this growing sector.

Differentiation of Services
Companies in e-commerce solutions differentiate via features, pricing, and customer service. Cart.com seeks differentiation through its unified platform and integrated services. The intensity of rivalry hinges on competitor differentiation levels. In 2024, the e-commerce market saw over $8 trillion in sales globally. Strong differentiation leads to less intense rivalry.
Switching Costs for Customers
Low switching costs in the e-commerce sector intensify competition. Customers can readily shift between platforms, increasing rivalry. Cart.com's integrated system may create some switching barriers, but easy tool adoption keeps competition high. The market is dynamic, with constant platform innovation.
- Shopify reported $7.1 billion in revenue for 2023, showing the competitiveness.
- Approximately 24 million e-commerce sites exist globally.
- The average customer spends 15 minutes on an e-commerce site.
- About 20% of customers abandon their shopping carts.
Acquisition and Partnership Strategies
Competitors in the e-commerce enablement space aggressively pursue acquisitions and partnerships. This boosts their capabilities and market presence, heightening rivalry. Cart.com's acquisition strategy is both a reaction to and a cause of this competitive environment. In 2024, the mergers and acquisitions (M&A) volume in the e-commerce sector reached $150 billion. This indicates a very active market.
- M&A volume in e-commerce hit $150B in 2024.
- Partnerships are common for tech integration.
- Cart.com uses acquisitions to grow.
- Competition includes large and small players.
E-commerce Showdown: $7.1B Revenue Battle!
Intense competition marks the e-commerce solutions market. Shopify's 2024 revenue of $7.1B highlights the rivalry. Differentiation and switching costs also influence competitive dynamics. Aggressive acquisitions and partnerships increase competition further.
| Factor | Impact | 2024 Data |
|---|---|---|
| Market Growth | High, driving competition | $6.3T global e-commerce sales |
| Differentiation | Reduces rivalry | Cart.com's unified platform |
| Switching Costs | Low, increasing rivalry | Easy platform shifts |
Original: $10.00
-65%$10.00
$3.50CART.COM PORTER'S FIVE FORCES TEMPLATE RESEARCH
What is included in the product
Evaluates control held by suppliers and buyers, and their influence on pricing and profitability.
Duplicate tabs allow comparing the Porter's Five Forces under varied scenarios for better strategic planning.
Same Document Delivered
Cart.com Porter's Five Forces Analysis
This preview showcases the exact Cart.com Porter's Five Forces analysis you'll receive upon purchase. It's a complete, ready-to-use document, professionally formatted. The insights displayed here are the same you'll get access to instantly after buying.
Porter's Five Forces Analysis Template
Don't Miss the Bigger Picture
Cart.com navigates a dynamic e-commerce landscape, where competition is fierce. Buyer power, driven by consumer choice, significantly impacts pricing strategies. The threat of new entrants, particularly from established tech players, looms large. Analyze supplier leverage and the presence of substitute services to truly grasp Cart.com's competitive position.
Our full Porter's Five Forces report goes deeper—offering a data-driven framework to understand Cart.com's real business risks and market opportunities.
Suppliers Bargaining Power
Dependence on Technology Providers
Cart.com's dependence on technology is significant, as its e-commerce platform and services are tech-driven. This reliance gives technology providers leverage, impacting Cart.com's costs and innovation capabilities. The need for specific software and cloud infrastructure, such as AWS, further strengthens their position. In 2024, the global cloud computing market was valued at over $670 billion, showcasing the tech providers' substantial influence.
Access to Fulfillment Infrastructure
Cart.com's fulfillment capabilities rely on suppliers of warehouse space, automation, and transportation. In 2024, warehouse lease rates in key US markets rose, potentially increasing Cart.com's costs. Automation technology costs also fluctuated, with some solutions increasing by up to 7%. Transportation expenses, including fuel and labor, also affected costs. These factors can influence Cart.com's service pricing.
Labor Market Conditions
Cart.com's supplier power is influenced by labor market conditions. The availability and cost of skilled labor, crucial for logistics and tech, directly affect operations. In 2024, the logistics sector faced a 5.8% increase in labor costs. Tight labor markets can lead to higher wage demands, impacting service quality and profitability. These factors increase supplier power.
Software and Service Providers
Cart.com relies on software and service providers like payment gateways and marketing tools, making it vulnerable to their bargaining power. These providers, including giants like Stripe and Google, can influence Cart.com's costs and operational efficiency through pricing and service terms. For instance, in 2024, the average cost for payment processing services increased by 5-7% due to rising demand and operational expenses. This dependency impacts Cart.com's profitability and flexibility.
- Payment processing fees, a key component, rose by approximately 6% in 2024.
- Marketing tool subscriptions and analytics services also saw price increases.
- Service availability and reliability are crucial for Cart.com's operations.
- Negotiating favorable terms is essential for mitigating supplier power.
Acquisition Strategy and Integration
Cart.com's acquisition strategy, like its purchase of Easyship, has brought crucial tech and services in-house, potentially lessening supplier power. However, this also means relying on smooth integration. In 2024, Cart.com's acquisitions included e-commerce and logistics firms, increasing internal control. Successful integration is key to leveraging these assets effectively.
- Acquisitions of companies with complementary services and technology.
- Bringing capabilities in-house can reduce the bargaining power of external suppliers.
- Successful integration of acquired assets and technologies is crucial.
- Cart.com's 2024 strategy included e-commerce and logistics firm acquisitions.
Supplier Dynamics Shaping E-commerce Costs
Cart.com faces supplier power from tech, fulfillment, and labor markets. Tech providers, like AWS, and payment processors, like Stripe, influence costs. In 2024, payment processing fees rose about 6%. Acquisitions, like Easyship, aim to reduce this power.
| Supplier Type | Impact on Cart.com | 2024 Data |
|---|---|---|
| Tech Providers | Influences costs and innovation | Cloud market over $670B |
| Fulfillment Suppliers | Affects service pricing | Warehouse lease rates up |
| Labor Market | Impacts service quality | Logistics labor costs +5.8% |
Customers Bargaining Power
Availability of Alternatives
Cart.com's customers possess substantial bargaining power due to the abundance of alternatives. They can opt for self-built e-commerce solutions or rival platforms. This competition forces Cart.com to maintain competitive pricing and superior service quality. In 2024, the e-commerce software market size was valued at $7.88 billion, highlighting the plethora of choices available to customers. If Cart.com's offerings falter, customers can readily switch providers.
Customer Concentration
If a handful of major clients contribute heavily to Cart.com's revenue, those clients wield substantial bargaining power. They can push for better deals, pricing, or tailored services, leveraging their significance to Cart.com. For example, if 30% of Cart.com's revenue comes from just three clients, those clients have considerable leverage in negotiations. In 2024, this concentration could lead to reduced profit margins if Cart.com has to concede on pricing to retain them.
Switching Costs
Switching costs significantly impact customer bargaining power. If it's easy to switch, customers have more leverage. Cart.com's integration of various e-commerce functions creates some "stickiness". In 2024, the average cost to migrate platforms ranged from $5,000-$25,000 depending on complexity.
Customer Knowledge and Information
Customers now possess unprecedented access to information, especially regarding e-commerce solutions and their pricing. This shift has significantly amplified their bargaining power, allowing them to negotiate favorable terms and demand greater value. According to Statista, e-commerce sales in the U.S. reached $1.1 trillion in 2023, demonstrating the substantial market influence of informed consumers. This trend puts pressure on platforms like Cart.com to remain competitive.
- Price Comparison: Customers can easily compare prices across different e-commerce platforms.
- Product Reviews: Access to reviews and ratings influences purchasing decisions.
- Negotiation: Customers can negotiate for better deals.
- Switching Costs: Low switching costs enable customers to switch providers easily.
Demand for Integrated Solutions
Cart.com's comprehensive services attract businesses looking for a one-stop e-commerce solution. This integrated approach can reduce customer bargaining power to some extent. In 2024, the e-commerce market saw a significant shift towards bundled services, with platforms like Shopify and BigCommerce offering similar packages. However, the existence of these alternatives still provides customers with options.
- Integrated solutions can reduce customer power.
- Market competition keeps customer options open.
- Shopify and BigCommerce are main competitors.
- Businesses seek one-stop e-commerce solutions.
How Customers Shape the E-Commerce Landscape
Cart.com customers benefit from many choices, including self-built solutions and rival platforms. This boosts their bargaining power, compelling Cart.com to be competitive. In 2024, the e-commerce software market was worth $7.88 billion, offering plenty of options.
Major clients significantly influence Cart.com's revenue and can demand better deals. If a few clients account for a large portion of revenue, they gain leverage. This concentration can pressure profit margins.
Switching costs affect customer power; easy switching gives customers more leverage. Cart.com's integrated services create some "stickiness." The average platform migration cost was $5,000-$25,000 in 2024.
| Factor | Impact on Customer Bargaining Power | 2024 Data/Example |
|---|---|---|
| Market Competition | High; many alternatives | E-commerce software market: $7.88B |
| Client Concentration | High for major clients | If 3 clients = 30% revenue |
| Switching Costs | Low = High Power | Migration cost: $5K-$25K |
Rivalry Among Competitors
Number and Diversity of Competitors
The e-commerce solutions market features numerous competitors, including Shopify, BigCommerce, and Adobe Commerce, alongside specialized providers. This diverse landscape intensifies competition. In 2024, Shopify's revenue reached approximately $7.1 billion, reflecting the intense rivalry for market share.
Market Growth Rate
The e-commerce market's growth is substantial, especially in fulfillment and digital payments. Despite this, competition remains fierce. In 2024, global e-commerce sales reached approximately $6.3 trillion. Companies compete aggressively for market share within this growing sector.
Differentiation of Services
Companies in e-commerce solutions differentiate via features, pricing, and customer service. Cart.com seeks differentiation through its unified platform and integrated services. The intensity of rivalry hinges on competitor differentiation levels. In 2024, the e-commerce market saw over $8 trillion in sales globally. Strong differentiation leads to less intense rivalry.
Switching Costs for Customers
Low switching costs in the e-commerce sector intensify competition. Customers can readily shift between platforms, increasing rivalry. Cart.com's integrated system may create some switching barriers, but easy tool adoption keeps competition high. The market is dynamic, with constant platform innovation.
- Shopify reported $7.1 billion in revenue for 2023, showing the competitiveness.
- Approximately 24 million e-commerce sites exist globally.
- The average customer spends 15 minutes on an e-commerce site.
- About 20% of customers abandon their shopping carts.
Acquisition and Partnership Strategies
Competitors in the e-commerce enablement space aggressively pursue acquisitions and partnerships. This boosts their capabilities and market presence, heightening rivalry. Cart.com's acquisition strategy is both a reaction to and a cause of this competitive environment. In 2024, the mergers and acquisitions (M&A) volume in the e-commerce sector reached $150 billion. This indicates a very active market.
- M&A volume in e-commerce hit $150B in 2024.
- Partnerships are common for tech integration.
- Cart.com uses acquisitions to grow.
- Competition includes large and small players.
E-commerce Showdown: $7.1B Revenue Battle!
Intense competition marks the e-commerce solutions market. Shopify's 2024 revenue of $7.1B highlights the rivalry. Differentiation and switching costs also influence competitive dynamics. Aggressive acquisitions and partnerships increase competition further.
| Factor | Impact | 2024 Data |
|---|---|---|
| Market Growth | High, driving competition | $6.3T global e-commerce sales |
| Differentiation | Reduces rivalry | Cart.com's unified platform |
| Switching Costs | Low, increasing rivalry | Easy platform shifts |
Product Information
Product Information
Shipping & Returns
Shipping & Returns
Description
What is included in the product
Evaluates control held by suppliers and buyers, and their influence on pricing and profitability.
Duplicate tabs allow comparing the Porter's Five Forces under varied scenarios for better strategic planning.
Same Document Delivered
Cart.com Porter's Five Forces Analysis
This preview showcases the exact Cart.com Porter's Five Forces analysis you'll receive upon purchase. It's a complete, ready-to-use document, professionally formatted. The insights displayed here are the same you'll get access to instantly after buying.
Porter's Five Forces Analysis Template
Don't Miss the Bigger Picture
Cart.com navigates a dynamic e-commerce landscape, where competition is fierce. Buyer power, driven by consumer choice, significantly impacts pricing strategies. The threat of new entrants, particularly from established tech players, looms large. Analyze supplier leverage and the presence of substitute services to truly grasp Cart.com's competitive position.
Our full Porter's Five Forces report goes deeper—offering a data-driven framework to understand Cart.com's real business risks and market opportunities.
Suppliers Bargaining Power
Dependence on Technology Providers
Cart.com's dependence on technology is significant, as its e-commerce platform and services are tech-driven. This reliance gives technology providers leverage, impacting Cart.com's costs and innovation capabilities. The need for specific software and cloud infrastructure, such as AWS, further strengthens their position. In 2024, the global cloud computing market was valued at over $670 billion, showcasing the tech providers' substantial influence.
Access to Fulfillment Infrastructure
Cart.com's fulfillment capabilities rely on suppliers of warehouse space, automation, and transportation. In 2024, warehouse lease rates in key US markets rose, potentially increasing Cart.com's costs. Automation technology costs also fluctuated, with some solutions increasing by up to 7%. Transportation expenses, including fuel and labor, also affected costs. These factors can influence Cart.com's service pricing.
Labor Market Conditions
Cart.com's supplier power is influenced by labor market conditions. The availability and cost of skilled labor, crucial for logistics and tech, directly affect operations. In 2024, the logistics sector faced a 5.8% increase in labor costs. Tight labor markets can lead to higher wage demands, impacting service quality and profitability. These factors increase supplier power.
Software and Service Providers
Cart.com relies on software and service providers like payment gateways and marketing tools, making it vulnerable to their bargaining power. These providers, including giants like Stripe and Google, can influence Cart.com's costs and operational efficiency through pricing and service terms. For instance, in 2024, the average cost for payment processing services increased by 5-7% due to rising demand and operational expenses. This dependency impacts Cart.com's profitability and flexibility.
- Payment processing fees, a key component, rose by approximately 6% in 2024.
- Marketing tool subscriptions and analytics services also saw price increases.
- Service availability and reliability are crucial for Cart.com's operations.
- Negotiating favorable terms is essential for mitigating supplier power.
Acquisition Strategy and Integration
Cart.com's acquisition strategy, like its purchase of Easyship, has brought crucial tech and services in-house, potentially lessening supplier power. However, this also means relying on smooth integration. In 2024, Cart.com's acquisitions included e-commerce and logistics firms, increasing internal control. Successful integration is key to leveraging these assets effectively.
- Acquisitions of companies with complementary services and technology.
- Bringing capabilities in-house can reduce the bargaining power of external suppliers.
- Successful integration of acquired assets and technologies is crucial.
- Cart.com's 2024 strategy included e-commerce and logistics firm acquisitions.
Supplier Dynamics Shaping E-commerce Costs
Cart.com faces supplier power from tech, fulfillment, and labor markets. Tech providers, like AWS, and payment processors, like Stripe, influence costs. In 2024, payment processing fees rose about 6%. Acquisitions, like Easyship, aim to reduce this power.
| Supplier Type | Impact on Cart.com | 2024 Data |
|---|---|---|
| Tech Providers | Influences costs and innovation | Cloud market over $670B |
| Fulfillment Suppliers | Affects service pricing | Warehouse lease rates up |
| Labor Market | Impacts service quality | Logistics labor costs +5.8% |
Customers Bargaining Power
Availability of Alternatives
Cart.com's customers possess substantial bargaining power due to the abundance of alternatives. They can opt for self-built e-commerce solutions or rival platforms. This competition forces Cart.com to maintain competitive pricing and superior service quality. In 2024, the e-commerce software market size was valued at $7.88 billion, highlighting the plethora of choices available to customers. If Cart.com's offerings falter, customers can readily switch providers.
Customer Concentration
If a handful of major clients contribute heavily to Cart.com's revenue, those clients wield substantial bargaining power. They can push for better deals, pricing, or tailored services, leveraging their significance to Cart.com. For example, if 30% of Cart.com's revenue comes from just three clients, those clients have considerable leverage in negotiations. In 2024, this concentration could lead to reduced profit margins if Cart.com has to concede on pricing to retain them.
Switching Costs
Switching costs significantly impact customer bargaining power. If it's easy to switch, customers have more leverage. Cart.com's integration of various e-commerce functions creates some "stickiness". In 2024, the average cost to migrate platforms ranged from $5,000-$25,000 depending on complexity.
Customer Knowledge and Information
Customers now possess unprecedented access to information, especially regarding e-commerce solutions and their pricing. This shift has significantly amplified their bargaining power, allowing them to negotiate favorable terms and demand greater value. According to Statista, e-commerce sales in the U.S. reached $1.1 trillion in 2023, demonstrating the substantial market influence of informed consumers. This trend puts pressure on platforms like Cart.com to remain competitive.
- Price Comparison: Customers can easily compare prices across different e-commerce platforms.
- Product Reviews: Access to reviews and ratings influences purchasing decisions.
- Negotiation: Customers can negotiate for better deals.
- Switching Costs: Low switching costs enable customers to switch providers easily.
Demand for Integrated Solutions
Cart.com's comprehensive services attract businesses looking for a one-stop e-commerce solution. This integrated approach can reduce customer bargaining power to some extent. In 2024, the e-commerce market saw a significant shift towards bundled services, with platforms like Shopify and BigCommerce offering similar packages. However, the existence of these alternatives still provides customers with options.
- Integrated solutions can reduce customer power.
- Market competition keeps customer options open.
- Shopify and BigCommerce are main competitors.
- Businesses seek one-stop e-commerce solutions.
How Customers Shape the E-Commerce Landscape
Cart.com customers benefit from many choices, including self-built solutions and rival platforms. This boosts their bargaining power, compelling Cart.com to be competitive. In 2024, the e-commerce software market was worth $7.88 billion, offering plenty of options.
Major clients significantly influence Cart.com's revenue and can demand better deals. If a few clients account for a large portion of revenue, they gain leverage. This concentration can pressure profit margins.
Switching costs affect customer power; easy switching gives customers more leverage. Cart.com's integrated services create some "stickiness." The average platform migration cost was $5,000-$25,000 in 2024.
| Factor | Impact on Customer Bargaining Power | 2024 Data/Example |
|---|---|---|
| Market Competition | High; many alternatives | E-commerce software market: $7.88B |
| Client Concentration | High for major clients | If 3 clients = 30% revenue |
| Switching Costs | Low = High Power | Migration cost: $5K-$25K |
Rivalry Among Competitors
Number and Diversity of Competitors
The e-commerce solutions market features numerous competitors, including Shopify, BigCommerce, and Adobe Commerce, alongside specialized providers. This diverse landscape intensifies competition. In 2024, Shopify's revenue reached approximately $7.1 billion, reflecting the intense rivalry for market share.
Market Growth Rate
The e-commerce market's growth is substantial, especially in fulfillment and digital payments. Despite this, competition remains fierce. In 2024, global e-commerce sales reached approximately $6.3 trillion. Companies compete aggressively for market share within this growing sector.
Differentiation of Services
Companies in e-commerce solutions differentiate via features, pricing, and customer service. Cart.com seeks differentiation through its unified platform and integrated services. The intensity of rivalry hinges on competitor differentiation levels. In 2024, the e-commerce market saw over $8 trillion in sales globally. Strong differentiation leads to less intense rivalry.
Switching Costs for Customers
Low switching costs in the e-commerce sector intensify competition. Customers can readily shift between platforms, increasing rivalry. Cart.com's integrated system may create some switching barriers, but easy tool adoption keeps competition high. The market is dynamic, with constant platform innovation.
- Shopify reported $7.1 billion in revenue for 2023, showing the competitiveness.
- Approximately 24 million e-commerce sites exist globally.
- The average customer spends 15 minutes on an e-commerce site.
- About 20% of customers abandon their shopping carts.
Acquisition and Partnership Strategies
Competitors in the e-commerce enablement space aggressively pursue acquisitions and partnerships. This boosts their capabilities and market presence, heightening rivalry. Cart.com's acquisition strategy is both a reaction to and a cause of this competitive environment. In 2024, the mergers and acquisitions (M&A) volume in the e-commerce sector reached $150 billion. This indicates a very active market.
- M&A volume in e-commerce hit $150B in 2024.
- Partnerships are common for tech integration.
- Cart.com uses acquisitions to grow.
- Competition includes large and small players.
E-commerce Showdown: $7.1B Revenue Battle!
Intense competition marks the e-commerce solutions market. Shopify's 2024 revenue of $7.1B highlights the rivalry. Differentiation and switching costs also influence competitive dynamics. Aggressive acquisitions and partnerships increase competition further.
| Factor | Impact | 2024 Data |
|---|---|---|
| Market Growth | High, driving competition | $6.3T global e-commerce sales |
| Differentiation | Reduces rivalry | Cart.com's unified platform |
| Switching Costs | Low, increasing rivalry | Easy platform shifts |


