CIRPLUS PORTER'S FIVE FORCES TEMPLATE RESEARCH
What is included in the product
Tailored exclusively for Cirplus, analyzing its position within its competitive landscape.
Easily visualize competitive dynamics using a dynamic interactive radar chart.
Same Document Delivered
Cirplus Porter's Five Forces Analysis
This preview showcases the complete Porter's Five Forces analysis for Cirplus. It's the identical document you'll receive after purchase. No edits or modifications are needed; it's immediately ready. Access this professionally crafted, in-depth analysis instantly. Everything you see is what you’ll get.

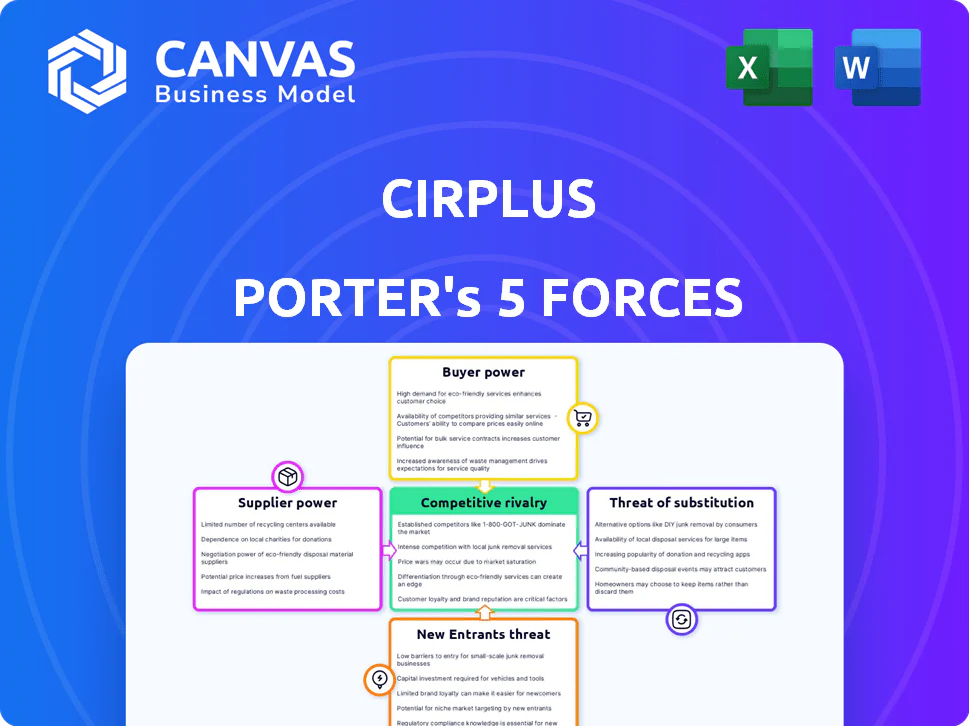
Porter's Five Forces Analysis Template
Don't Miss the Bigger Picture
Cirplus operates within a complex market. Supplier power, particularly concerning recycled materials, is a key factor. Buyer power, influenced by market demand, shapes pricing strategies. The threat of new entrants is moderate, given existing infrastructure investments. Substitute products, primarily virgin plastics, present a significant challenge. Competitive rivalry is intensifying as the circular economy expands.
The complete report reveals the real forces shaping Cirplus’s industry—from supplier influence to threat of new entrants. Gain actionable insights to drive smarter decision-making.
Suppliers Bargaining Power
Availability of Recycled Plastic Feedstock
The bargaining power of suppliers in the recycled plastic market is significantly influenced by the availability of post-consumer waste. Limited supply and inconsistent quality, which can be affected by collection rates and contamination, strengthen suppliers' control over pricing. For instance, in 2024, the global plastic waste generation reached approximately 400 million metric tons, yet only about 9% was recycled, indicating a supply constraint. This scarcity gives suppliers, such as waste management companies, greater leverage.
Fragmentation of the Supplier Market
The recycled plastics market often sees many small to medium-sized recyclers, creating a fragmented supplier base. This fragmentation typically lessens the power of individual suppliers. Buyers on platforms like Cirplus gain more choices and leverage. For example, in 2024, over 6,000 recycling facilities operated in Europe.

Cost of Collection and Processing
Recyclers' costs for collection, sorting, cleaning, and processing plastic significantly affect pricing. Energy price shifts, labor expenses, and compliance costs influence the suppliers' power. In 2024, energy costs rose 5%, impacting operational expenses. Labor costs in recycling increased by 7%, boosting overall expenses.
Technological Advancements in Recycling
Technological advancements in recycling, like advanced or chemical recycling, are changing the game for suppliers. These innovations enable the production of higher-quality recyclates, boosting their value. Suppliers with these technologies gain more power because their materials are in higher demand and have broader applications. For example, the chemical recycling market is projected to reach $10.5 billion by 2029.
- Chemical recycling capacity is expected to grow significantly, with the potential to process millions of tons of plastic waste annually.
- Investments in recycling technologies are increasing, with venture capital and private equity firms actively funding innovative solutions.
- The use of recycled materials is rising across various industries due to sustainability goals and consumer demand.
- Advanced recycling processes can handle complex plastic waste streams, expanding the range of materials that can be recycled.
Regulations and Standards
Evolving regulations and standards significantly impact supplier power within the recycled plastics market, as seen with Cirplus. Stricter mandates for recycled content and quality create advantages for compliant suppliers. The EU's Single-Use Plastics Directive, for instance, demands high recycled content levels. This increases the bargaining power of suppliers capable of meeting these demands.
- EU plastic packaging recycling targets: 50% by 2025, 55% by 2030.
- Demand for recycled plastics is projected to grow, with a compound annual growth rate (CAGR) of 6.5% from 2024-2030.
- Companies face penalties for non-compliance with recycled content regulations.
- Suppliers with certifications like ISCC PLUS gain a competitive edge.
Recycled Plastics: Supplier Power Dynamics
The bargaining power of suppliers in the recycled plastics market fluctuates based on waste availability and market dynamics. Limited supply and inconsistent quality boost supplier control, as seen with only 9% of the 400 million metric tons of global plastic waste being recycled in 2024.
Fragmented supplier bases, like the 6,000+ recycling facilities in Europe in 2024, typically weaken individual supplier influence, giving buyers more leverage on platforms like Cirplus.
Technological advancements and evolving regulations further reshape supplier power; for instance, the chemical recycling market is projected to reach $10.5 billion by 2029, while EU recycling targets drive demand for compliant suppliers.
| Factor | Impact | Data (2024) |
|---|---|---|
| Waste Supply | Limited supply strengthens suppliers | 9% global plastic waste recycled |
| Market Structure | Fragmented market weakens suppliers | 6,000+ recycling facilities in Europe |
| Tech & Regulation | Boosts compliant suppliers | Chemical recycling market: $10.5B by 2029 |
Customers Bargaining Power
Demand for Recycled Plastics
The rising demand for recycled plastics boosts buyer power on Cirplus. Industries' sustainability goals and regulations fuel this trend. As of late 2024, the global recycled plastics market is valued at over $40 billion. Increased demand strengthens buyers' negotiation positions.
Availability of Virgin Plastic Alternatives
In 2024, the price and availability of virgin plastic directly impact customer bargaining power in the recycled plastics market. If virgin plastic prices are low, buyers might opt for it over more expensive recycled alternatives, strengthening their position. For example, in Q3 2024, virgin polyethylene prices fluctuated, influencing demand for recycled HDPE. This dynamic influences the market's competitive landscape.

Customer Concentration
Customer concentration is a crucial factor for Cirplus. If a few major buyers dominate demand, their bargaining power increases significantly. These large customers can leverage their purchasing volume to demand better prices and terms. For instance, if the top 5 buyers account for over 60% of transactions, their influence is substantial, as seen in similar B2B platforms in 2024.
Switching Costs for Buyers
Switching costs significantly influence customer bargaining power within the plastics industry. When buyers can easily switch to alternatives like recycled plastics or different suppliers without significant costs, their power increases. Conversely, high switching costs, such as those related to specific material needs or process overhauls, diminish buyer power. For example, in 2024, the global market for recycled plastics was valued at approximately $45 billion, showing the availability of alternatives.
- Low switching costs empower buyers, increasing their negotiation leverage.
- High switching costs, like specialized material needs, reduce buyer power.
- The 2024 recycled plastics market offers diverse alternatives.
- Process adjustments can be costly, impacting switching ability.
Transparency and Information on the Platform
Cirplus's platform, offering pricing and quality transparency, strengthens buyer power. This allows for informed decisions and effective negotiations. Buyers can compare offers and push for better terms. Increased information access shifts the balance of power.
- Transparency boosts buyer leverage.
- Information access drives negotiation.
- Buyers can compare and choose.
- 2024 data shows rising demand for recycled plastics.
Recycled Plastics: Buyer Power Surges
Buyers gain power in recycled plastics due to rising demand and platform transparency. Low virgin plastic prices can weaken this, but the $45B recycled market offers alternatives. Concentrated buyers also increase leverage.
| Factor | Impact | Example (2024) |
|---|---|---|
| Demand | High demand boosts buyer leverage | Recycled plastics market at $45B |
| Transparency | Informed decisions, better terms | Cirplus platform |
| Switching Costs | Low costs enhance buyer power | Easy access to alternatives |
Rivalry Among Competitors
Number and Size of Competitors
The competitive landscape for B2B platforms like Cirplus, dealing in recycled plastics, is shaped by the number and size of rivals. In 2024, the market features numerous players, including specialized platforms and general commodity exchanges. This high level of competition may intensify price wars. For example, in 2023, the average price for recycled PET flakes fluctuated, showing the impact of market dynamics.
Differentiation of Services
Cirplus's ability to stand out through service differentiation strongly impacts competitive rivalry. Providing unique features, like advanced quality checks, logistics help, or data insights, can lessen price-based competition. In 2024, platforms offering specialized services saw a 15% increase in user engagement. This strategy is key to reducing direct competition.

Market Growth Rate
The recycled plastics market is expanding, fueled by environmental and policy pressures. This growth eases competition, as companies can target new demand. The global recycled plastics market was valued at $44.2 billion in 2023 and is projected to reach $65.3 billion by 2028.
Switching Costs for Platform Users
Switching costs for platform users significantly impact competitive rivalry. If it's easy for buyers and sellers to switch, Cirplus faces greater pressure to compete. Low switching costs mean users can readily move to rival platforms, intensifying competition. For instance, platforms with subscription models might see higher user retention due to existing financial commitments.
- In 2024, the average customer acquisition cost (CAC) for online marketplaces ranged from $50 to $500, showing the importance of user retention.
- Market research in late 2024 revealed that 60% of users cited ease of use as a primary factor in platform choice, emphasizing the need for a user-friendly interface.
- Switching costs related to data migration and learning new platforms increased competition.
Barriers to Exit
High exit barriers in the recycled plastics market can fuel rivalry among companies. When firms struggle to leave, they might compete fiercely even when profits are low. This persistence often leads to price wars and innovation battles. For example, in 2024, the sector saw increased competition due to overcapacity.
- High exit costs intensify competition.
- Companies may fight for market share.
- Profit margins can be squeezed.
- Innovation becomes a key battleground.
Recycled Plastics Platform: Fierce Competition Ahead!
Competitive rivalry within the recycled plastics B2B platform market in 2024 is intense, driven by many players and price wars. Differentiation through unique services, like advanced quality checks, is crucial to reduce competition. Market growth, with a projected value of $65.3 billion by 2028, mitigates rivalry. High exit barriers and low switching costs intensify competition.
| Factor | Impact | Example (2024) |
|---|---|---|
| Number of Rivals | High competition | Many specialized platforms |
| Differentiation | Reduces price wars | 15% increase in user engagement for specialized services |
| Market Growth | Eases competition | Projected to $65.3B by 2028 |
Original: $10.00
-65%$10.00
$3.50CIRPLUS PORTER'S FIVE FORCES TEMPLATE RESEARCH
What is included in the product
Tailored exclusively for Cirplus, analyzing its position within its competitive landscape.
Easily visualize competitive dynamics using a dynamic interactive radar chart.
Same Document Delivered
Cirplus Porter's Five Forces Analysis
This preview showcases the complete Porter's Five Forces analysis for Cirplus. It's the identical document you'll receive after purchase. No edits or modifications are needed; it's immediately ready. Access this professionally crafted, in-depth analysis instantly. Everything you see is what you’ll get.
Porter's Five Forces Analysis Template
Don't Miss the Bigger Picture
Cirplus operates within a complex market. Supplier power, particularly concerning recycled materials, is a key factor. Buyer power, influenced by market demand, shapes pricing strategies. The threat of new entrants is moderate, given existing infrastructure investments. Substitute products, primarily virgin plastics, present a significant challenge. Competitive rivalry is intensifying as the circular economy expands.
The complete report reveals the real forces shaping Cirplus’s industry—from supplier influence to threat of new entrants. Gain actionable insights to drive smarter decision-making.
Suppliers Bargaining Power
Availability of Recycled Plastic Feedstock
The bargaining power of suppliers in the recycled plastic market is significantly influenced by the availability of post-consumer waste. Limited supply and inconsistent quality, which can be affected by collection rates and contamination, strengthen suppliers' control over pricing. For instance, in 2024, the global plastic waste generation reached approximately 400 million metric tons, yet only about 9% was recycled, indicating a supply constraint. This scarcity gives suppliers, such as waste management companies, greater leverage.
Fragmentation of the Supplier Market
The recycled plastics market often sees many small to medium-sized recyclers, creating a fragmented supplier base. This fragmentation typically lessens the power of individual suppliers. Buyers on platforms like Cirplus gain more choices and leverage. For example, in 2024, over 6,000 recycling facilities operated in Europe.
Cost of Collection and Processing
Recyclers' costs for collection, sorting, cleaning, and processing plastic significantly affect pricing. Energy price shifts, labor expenses, and compliance costs influence the suppliers' power. In 2024, energy costs rose 5%, impacting operational expenses. Labor costs in recycling increased by 7%, boosting overall expenses.
Technological Advancements in Recycling
Technological advancements in recycling, like advanced or chemical recycling, are changing the game for suppliers. These innovations enable the production of higher-quality recyclates, boosting their value. Suppliers with these technologies gain more power because their materials are in higher demand and have broader applications. For example, the chemical recycling market is projected to reach $10.5 billion by 2029.
- Chemical recycling capacity is expected to grow significantly, with the potential to process millions of tons of plastic waste annually.
- Investments in recycling technologies are increasing, with venture capital and private equity firms actively funding innovative solutions.
- The use of recycled materials is rising across various industries due to sustainability goals and consumer demand.
- Advanced recycling processes can handle complex plastic waste streams, expanding the range of materials that can be recycled.
Regulations and Standards
Evolving regulations and standards significantly impact supplier power within the recycled plastics market, as seen with Cirplus. Stricter mandates for recycled content and quality create advantages for compliant suppliers. The EU's Single-Use Plastics Directive, for instance, demands high recycled content levels. This increases the bargaining power of suppliers capable of meeting these demands.
- EU plastic packaging recycling targets: 50% by 2025, 55% by 2030.
- Demand for recycled plastics is projected to grow, with a compound annual growth rate (CAGR) of 6.5% from 2024-2030.
- Companies face penalties for non-compliance with recycled content regulations.
- Suppliers with certifications like ISCC PLUS gain a competitive edge.
Recycled Plastics: Supplier Power Dynamics
The bargaining power of suppliers in the recycled plastics market fluctuates based on waste availability and market dynamics. Limited supply and inconsistent quality boost supplier control, as seen with only 9% of the 400 million metric tons of global plastic waste being recycled in 2024.
Fragmented supplier bases, like the 6,000+ recycling facilities in Europe in 2024, typically weaken individual supplier influence, giving buyers more leverage on platforms like Cirplus.
Technological advancements and evolving regulations further reshape supplier power; for instance, the chemical recycling market is projected to reach $10.5 billion by 2029, while EU recycling targets drive demand for compliant suppliers.
| Factor | Impact | Data (2024) |
|---|---|---|
| Waste Supply | Limited supply strengthens suppliers | 9% global plastic waste recycled |
| Market Structure | Fragmented market weakens suppliers | 6,000+ recycling facilities in Europe |
| Tech & Regulation | Boosts compliant suppliers | Chemical recycling market: $10.5B by 2029 |
Customers Bargaining Power
Demand for Recycled Plastics
The rising demand for recycled plastics boosts buyer power on Cirplus. Industries' sustainability goals and regulations fuel this trend. As of late 2024, the global recycled plastics market is valued at over $40 billion. Increased demand strengthens buyers' negotiation positions.
Availability of Virgin Plastic Alternatives
In 2024, the price and availability of virgin plastic directly impact customer bargaining power in the recycled plastics market. If virgin plastic prices are low, buyers might opt for it over more expensive recycled alternatives, strengthening their position. For example, in Q3 2024, virgin polyethylene prices fluctuated, influencing demand for recycled HDPE. This dynamic influences the market's competitive landscape.
Customer Concentration
Customer concentration is a crucial factor for Cirplus. If a few major buyers dominate demand, their bargaining power increases significantly. These large customers can leverage their purchasing volume to demand better prices and terms. For instance, if the top 5 buyers account for over 60% of transactions, their influence is substantial, as seen in similar B2B platforms in 2024.
Switching Costs for Buyers
Switching costs significantly influence customer bargaining power within the plastics industry. When buyers can easily switch to alternatives like recycled plastics or different suppliers without significant costs, their power increases. Conversely, high switching costs, such as those related to specific material needs or process overhauls, diminish buyer power. For example, in 2024, the global market for recycled plastics was valued at approximately $45 billion, showing the availability of alternatives.
- Low switching costs empower buyers, increasing their negotiation leverage.
- High switching costs, like specialized material needs, reduce buyer power.
- The 2024 recycled plastics market offers diverse alternatives.
- Process adjustments can be costly, impacting switching ability.
Transparency and Information on the Platform
Cirplus's platform, offering pricing and quality transparency, strengthens buyer power. This allows for informed decisions and effective negotiations. Buyers can compare offers and push for better terms. Increased information access shifts the balance of power.
- Transparency boosts buyer leverage.
- Information access drives negotiation.
- Buyers can compare and choose.
- 2024 data shows rising demand for recycled plastics.
Recycled Plastics: Buyer Power Surges
Buyers gain power in recycled plastics due to rising demand and platform transparency. Low virgin plastic prices can weaken this, but the $45B recycled market offers alternatives. Concentrated buyers also increase leverage.
| Factor | Impact | Example (2024) |
|---|---|---|
| Demand | High demand boosts buyer leverage | Recycled plastics market at $45B |
| Transparency | Informed decisions, better terms | Cirplus platform |
| Switching Costs | Low costs enhance buyer power | Easy access to alternatives |
Rivalry Among Competitors
Number and Size of Competitors
The competitive landscape for B2B platforms like Cirplus, dealing in recycled plastics, is shaped by the number and size of rivals. In 2024, the market features numerous players, including specialized platforms and general commodity exchanges. This high level of competition may intensify price wars. For example, in 2023, the average price for recycled PET flakes fluctuated, showing the impact of market dynamics.
Differentiation of Services
Cirplus's ability to stand out through service differentiation strongly impacts competitive rivalry. Providing unique features, like advanced quality checks, logistics help, or data insights, can lessen price-based competition. In 2024, platforms offering specialized services saw a 15% increase in user engagement. This strategy is key to reducing direct competition.
Market Growth Rate
The recycled plastics market is expanding, fueled by environmental and policy pressures. This growth eases competition, as companies can target new demand. The global recycled plastics market was valued at $44.2 billion in 2023 and is projected to reach $65.3 billion by 2028.
Switching Costs for Platform Users
Switching costs for platform users significantly impact competitive rivalry. If it's easy for buyers and sellers to switch, Cirplus faces greater pressure to compete. Low switching costs mean users can readily move to rival platforms, intensifying competition. For instance, platforms with subscription models might see higher user retention due to existing financial commitments.
- In 2024, the average customer acquisition cost (CAC) for online marketplaces ranged from $50 to $500, showing the importance of user retention.
- Market research in late 2024 revealed that 60% of users cited ease of use as a primary factor in platform choice, emphasizing the need for a user-friendly interface.
- Switching costs related to data migration and learning new platforms increased competition.
Barriers to Exit
High exit barriers in the recycled plastics market can fuel rivalry among companies. When firms struggle to leave, they might compete fiercely even when profits are low. This persistence often leads to price wars and innovation battles. For example, in 2024, the sector saw increased competition due to overcapacity.
- High exit costs intensify competition.
- Companies may fight for market share.
- Profit margins can be squeezed.
- Innovation becomes a key battleground.
Recycled Plastics Platform: Fierce Competition Ahead!
Competitive rivalry within the recycled plastics B2B platform market in 2024 is intense, driven by many players and price wars. Differentiation through unique services, like advanced quality checks, is crucial to reduce competition. Market growth, with a projected value of $65.3 billion by 2028, mitigates rivalry. High exit barriers and low switching costs intensify competition.
| Factor | Impact | Example (2024) |
|---|---|---|
| Number of Rivals | High competition | Many specialized platforms |
| Differentiation | Reduces price wars | 15% increase in user engagement for specialized services |
| Market Growth | Eases competition | Projected to $65.3B by 2028 |
Product Information
Product Information
Shipping & Returns
Shipping & Returns
Description
What is included in the product
Tailored exclusively for Cirplus, analyzing its position within its competitive landscape.
Easily visualize competitive dynamics using a dynamic interactive radar chart.
Same Document Delivered
Cirplus Porter's Five Forces Analysis
This preview showcases the complete Porter's Five Forces analysis for Cirplus. It's the identical document you'll receive after purchase. No edits or modifications are needed; it's immediately ready. Access this professionally crafted, in-depth analysis instantly. Everything you see is what you’ll get.
Porter's Five Forces Analysis Template
Don't Miss the Bigger Picture
Cirplus operates within a complex market. Supplier power, particularly concerning recycled materials, is a key factor. Buyer power, influenced by market demand, shapes pricing strategies. The threat of new entrants is moderate, given existing infrastructure investments. Substitute products, primarily virgin plastics, present a significant challenge. Competitive rivalry is intensifying as the circular economy expands.
The complete report reveals the real forces shaping Cirplus’s industry—from supplier influence to threat of new entrants. Gain actionable insights to drive smarter decision-making.
Suppliers Bargaining Power
Availability of Recycled Plastic Feedstock
The bargaining power of suppliers in the recycled plastic market is significantly influenced by the availability of post-consumer waste. Limited supply and inconsistent quality, which can be affected by collection rates and contamination, strengthen suppliers' control over pricing. For instance, in 2024, the global plastic waste generation reached approximately 400 million metric tons, yet only about 9% was recycled, indicating a supply constraint. This scarcity gives suppliers, such as waste management companies, greater leverage.
Fragmentation of the Supplier Market
The recycled plastics market often sees many small to medium-sized recyclers, creating a fragmented supplier base. This fragmentation typically lessens the power of individual suppliers. Buyers on platforms like Cirplus gain more choices and leverage. For example, in 2024, over 6,000 recycling facilities operated in Europe.
Cost of Collection and Processing
Recyclers' costs for collection, sorting, cleaning, and processing plastic significantly affect pricing. Energy price shifts, labor expenses, and compliance costs influence the suppliers' power. In 2024, energy costs rose 5%, impacting operational expenses. Labor costs in recycling increased by 7%, boosting overall expenses.
Technological Advancements in Recycling
Technological advancements in recycling, like advanced or chemical recycling, are changing the game for suppliers. These innovations enable the production of higher-quality recyclates, boosting their value. Suppliers with these technologies gain more power because their materials are in higher demand and have broader applications. For example, the chemical recycling market is projected to reach $10.5 billion by 2029.
- Chemical recycling capacity is expected to grow significantly, with the potential to process millions of tons of plastic waste annually.
- Investments in recycling technologies are increasing, with venture capital and private equity firms actively funding innovative solutions.
- The use of recycled materials is rising across various industries due to sustainability goals and consumer demand.
- Advanced recycling processes can handle complex plastic waste streams, expanding the range of materials that can be recycled.
Regulations and Standards
Evolving regulations and standards significantly impact supplier power within the recycled plastics market, as seen with Cirplus. Stricter mandates for recycled content and quality create advantages for compliant suppliers. The EU's Single-Use Plastics Directive, for instance, demands high recycled content levels. This increases the bargaining power of suppliers capable of meeting these demands.
- EU plastic packaging recycling targets: 50% by 2025, 55% by 2030.
- Demand for recycled plastics is projected to grow, with a compound annual growth rate (CAGR) of 6.5% from 2024-2030.
- Companies face penalties for non-compliance with recycled content regulations.
- Suppliers with certifications like ISCC PLUS gain a competitive edge.
Recycled Plastics: Supplier Power Dynamics
The bargaining power of suppliers in the recycled plastics market fluctuates based on waste availability and market dynamics. Limited supply and inconsistent quality boost supplier control, as seen with only 9% of the 400 million metric tons of global plastic waste being recycled in 2024.
Fragmented supplier bases, like the 6,000+ recycling facilities in Europe in 2024, typically weaken individual supplier influence, giving buyers more leverage on platforms like Cirplus.
Technological advancements and evolving regulations further reshape supplier power; for instance, the chemical recycling market is projected to reach $10.5 billion by 2029, while EU recycling targets drive demand for compliant suppliers.
| Factor | Impact | Data (2024) |
|---|---|---|
| Waste Supply | Limited supply strengthens suppliers | 9% global plastic waste recycled |
| Market Structure | Fragmented market weakens suppliers | 6,000+ recycling facilities in Europe |
| Tech & Regulation | Boosts compliant suppliers | Chemical recycling market: $10.5B by 2029 |
Customers Bargaining Power
Demand for Recycled Plastics
The rising demand for recycled plastics boosts buyer power on Cirplus. Industries' sustainability goals and regulations fuel this trend. As of late 2024, the global recycled plastics market is valued at over $40 billion. Increased demand strengthens buyers' negotiation positions.
Availability of Virgin Plastic Alternatives
In 2024, the price and availability of virgin plastic directly impact customer bargaining power in the recycled plastics market. If virgin plastic prices are low, buyers might opt for it over more expensive recycled alternatives, strengthening their position. For example, in Q3 2024, virgin polyethylene prices fluctuated, influencing demand for recycled HDPE. This dynamic influences the market's competitive landscape.
Customer Concentration
Customer concentration is a crucial factor for Cirplus. If a few major buyers dominate demand, their bargaining power increases significantly. These large customers can leverage their purchasing volume to demand better prices and terms. For instance, if the top 5 buyers account for over 60% of transactions, their influence is substantial, as seen in similar B2B platforms in 2024.
Switching Costs for Buyers
Switching costs significantly influence customer bargaining power within the plastics industry. When buyers can easily switch to alternatives like recycled plastics or different suppliers without significant costs, their power increases. Conversely, high switching costs, such as those related to specific material needs or process overhauls, diminish buyer power. For example, in 2024, the global market for recycled plastics was valued at approximately $45 billion, showing the availability of alternatives.
- Low switching costs empower buyers, increasing their negotiation leverage.
- High switching costs, like specialized material needs, reduce buyer power.
- The 2024 recycled plastics market offers diverse alternatives.
- Process adjustments can be costly, impacting switching ability.
Transparency and Information on the Platform
Cirplus's platform, offering pricing and quality transparency, strengthens buyer power. This allows for informed decisions and effective negotiations. Buyers can compare offers and push for better terms. Increased information access shifts the balance of power.
- Transparency boosts buyer leverage.
- Information access drives negotiation.
- Buyers can compare and choose.
- 2024 data shows rising demand for recycled plastics.
Recycled Plastics: Buyer Power Surges
Buyers gain power in recycled plastics due to rising demand and platform transparency. Low virgin plastic prices can weaken this, but the $45B recycled market offers alternatives. Concentrated buyers also increase leverage.
| Factor | Impact | Example (2024) |
|---|---|---|
| Demand | High demand boosts buyer leverage | Recycled plastics market at $45B |
| Transparency | Informed decisions, better terms | Cirplus platform |
| Switching Costs | Low costs enhance buyer power | Easy access to alternatives |
Rivalry Among Competitors
Number and Size of Competitors
The competitive landscape for B2B platforms like Cirplus, dealing in recycled plastics, is shaped by the number and size of rivals. In 2024, the market features numerous players, including specialized platforms and general commodity exchanges. This high level of competition may intensify price wars. For example, in 2023, the average price for recycled PET flakes fluctuated, showing the impact of market dynamics.
Differentiation of Services
Cirplus's ability to stand out through service differentiation strongly impacts competitive rivalry. Providing unique features, like advanced quality checks, logistics help, or data insights, can lessen price-based competition. In 2024, platforms offering specialized services saw a 15% increase in user engagement. This strategy is key to reducing direct competition.
Market Growth Rate
The recycled plastics market is expanding, fueled by environmental and policy pressures. This growth eases competition, as companies can target new demand. The global recycled plastics market was valued at $44.2 billion in 2023 and is projected to reach $65.3 billion by 2028.
Switching Costs for Platform Users
Switching costs for platform users significantly impact competitive rivalry. If it's easy for buyers and sellers to switch, Cirplus faces greater pressure to compete. Low switching costs mean users can readily move to rival platforms, intensifying competition. For instance, platforms with subscription models might see higher user retention due to existing financial commitments.
- In 2024, the average customer acquisition cost (CAC) for online marketplaces ranged from $50 to $500, showing the importance of user retention.
- Market research in late 2024 revealed that 60% of users cited ease of use as a primary factor in platform choice, emphasizing the need for a user-friendly interface.
- Switching costs related to data migration and learning new platforms increased competition.
Barriers to Exit
High exit barriers in the recycled plastics market can fuel rivalry among companies. When firms struggle to leave, they might compete fiercely even when profits are low. This persistence often leads to price wars and innovation battles. For example, in 2024, the sector saw increased competition due to overcapacity.
- High exit costs intensify competition.
- Companies may fight for market share.
- Profit margins can be squeezed.
- Innovation becomes a key battleground.
Recycled Plastics Platform: Fierce Competition Ahead!
Competitive rivalry within the recycled plastics B2B platform market in 2024 is intense, driven by many players and price wars. Differentiation through unique services, like advanced quality checks, is crucial to reduce competition. Market growth, with a projected value of $65.3 billion by 2028, mitigates rivalry. High exit barriers and low switching costs intensify competition.
| Factor | Impact | Example (2024) |
|---|---|---|
| Number of Rivals | High competition | Many specialized platforms |
| Differentiation | Reduces price wars | 15% increase in user engagement for specialized services |
| Market Growth | Eases competition | Projected to $65.3B by 2028 |


