CONNEXT PORTER'S FIVE FORCES TEMPLATE RESEARCH
What is included in the product
Tailored exclusively for Connext, analyzing its position within its competitive landscape.
Customize pressure levels based on new data or evolving market trends.
What You See Is What You Get
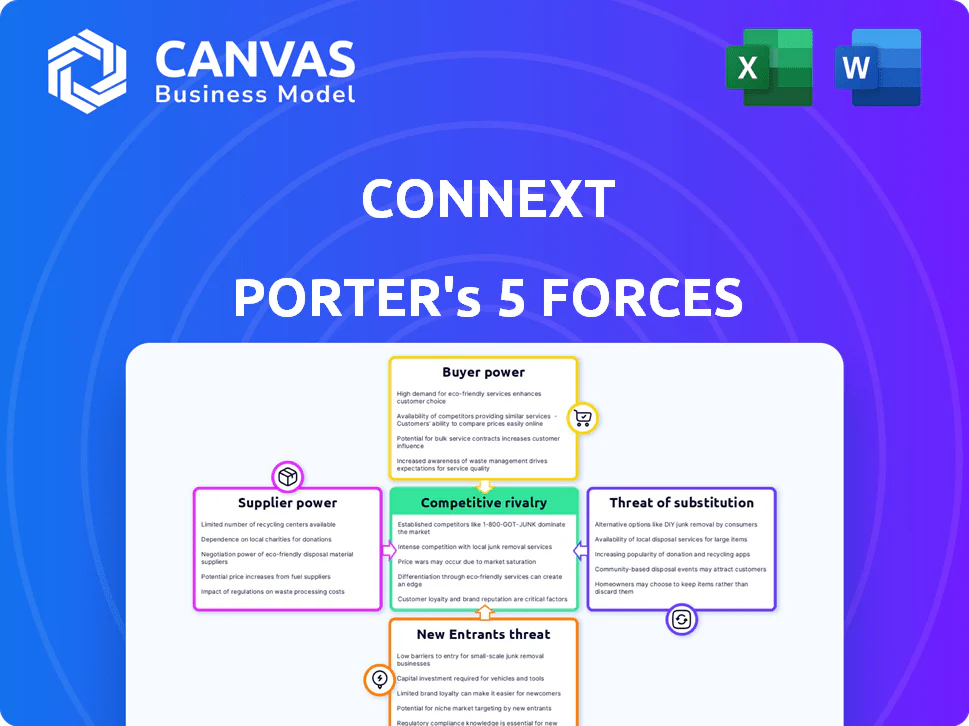
Connext Porter's Five Forces Analysis
This preview reveals the complete Porter's Five Forces analysis for Connext. It's the identical, ready-to-use document you'll download instantly after purchase.

Porter's Five Forces Analysis Template
A Must-Have Tool for Decision-Makers
Connext faces a dynamic competitive landscape. Analyzing the threat of new entrants, supplier power, and buyer bargaining power is crucial for understanding its position. The intensity of rivalry and the threat of substitutes also significantly shape Connext's success. These forces determine profitability and strategic options.
Our full Porter's Five Forces report goes deeper—offering a data-driven framework to understand Connext's real business risks and market opportunities.
Suppliers Bargaining Power
Key Technology Providers
Connext's dependence on blockchain tech (Ethereum, EVM-compatible chains) and infrastructure providers gives these suppliers bargaining power. The cost of using Ethereum, for instance, can fluctuate significantly, impacting Connext's operational costs. Ethereum's average transaction fees in 2024 ranged from $1 to $100+, showing volatility. Changes in these providers' fees or services directly affect Connext's profitability and scalability.
Liquidity Providers (Routers)
Routers are essential liquidity providers in the Connext network, enabling transactions. Their bargaining power hinges on factors like router count and ease of entry. Fewer routers or high entry barriers amplify their influence.

Oracle Services
Connext uses oracle services for trustless communication and data transfer, relying on external data for its blockchain. The bargaining power of oracle providers like Chainlink, a major player, is significant. Chainlink's market capitalization in early 2024 was around $10 billion, showcasing its influence.
The uniqueness of their data feeds and the availability of alternatives affect this power. If Connext depends heavily on specialized data from a single oracle, that provider gains leverage. However, the presence of competitors and open-source solutions can reduce this power.
For example, the growth of decentralized oracle networks offers Connext more options. Competition keeps prices competitive. The dependence on specific oracle services will shape Connext's operational costs and flexibility, a key factor for 2024 and beyond.
Security and Auditing Services
Connext's reliance on security audits grants providers some bargaining power. These services are crucial for maintaining the protocol's integrity. The reputation of security firms directly impacts Connext's trustworthiness. High demand for top-tier auditors further strengthens their position. In 2024, the cybersecurity market is valued at over $200 billion, highlighting the significance of these services.
- Criticality of Security: Security audits are essential for an interoperability protocol's functionality.
- Reputation Matters: Expertise and reputation of providers directly affect Connext's credibility.
- Market Dynamics: High demand in the cybersecurity market enhances provider bargaining power.
- 2024 Market Value: Cybersecurity market exceeds $200 billion, emphasizing service importance.
Development Tool Providers
Connext relies on development tool providers, impacting its operations. The cost and accessibility of these tools affect Connext's ability to integrate with other dApps. Providers' pricing strategies and technological advancements are key factors. For example, the global market for software development tools was valued at $79.6 billion in 2023.
- Tool costs can significantly influence Connext's expenses.
- Availability of tools affects integration timelines.
- Provider innovation drives Connext's capabilities.
- Connext's dependence creates supplier power dynamics.
Blockchain's Grip on Operational Costs
Suppliers of blockchain tech, including Ethereum, wield substantial bargaining power over Connext, influencing its operational expenses. Router influence depends on their numbers and ease of network entry. Oracle providers like Chainlink, with a market cap around $10B in early 2024, also exert considerable power.
| Supplier Type | Bargaining Power Factor | 2024 Impact |
|---|---|---|
| Blockchain Infrastructure | Cost Volatility | Ethereum fees varied greatly, impacting costs. |
| Routers | Network Entry | Fewer routers increase influence. |
| Oracle Providers | Market Cap/Data Uniqueness | Chainlink's $10B cap gives leverage. |
Customers Bargaining Power
dApp Developers and Users
Connext's customers, dApp developers and users, wield significant bargaining power. They can choose from multiple interoperability solutions, including LayerZero and Wormhole. Switching costs are low, empowering them to demand competitive pricing and service quality. In 2024, the total value locked (TVL) in cross-chain bridges fluctuated, reflecting customer mobility. The sector saw over $50 billion in transactions in the first half of 2024.
Need for Seamless Cross-Chain Experience
Customers now expect easy and cheap cross-chain transactions. Connext's success depends on satisfying these needs. A recent report showed that cross-chain bridge usage surged by 300% in 2024. If Connext fails, users will switch to rivals. This shift affects Connext's market position and profitability.

Availability of Alternatives
Customers benefit from many interoperability choices. This includes protocols and bridges. Data from 2024 shows the rise of multiple chains. This increased customer bargaining power.
Switching Costs for Users and Developers
The bargaining power of customers regarding Connext Porter is complex, varying between end-users and developers. End-users, often using multiple wallets, face low switching costs. Developers, however, who have integrated Connext into their dApps, may incur higher costs to switch. These costs include re-engineering efforts and potential disruptions. Consider that in 2024, over 60% of blockchain developers use multiple protocols.
- End-users: Low switching costs due to multiple wallet usage.
- Developers: Higher switching costs due to integration efforts.
- Market Data: Over 60% of developers use multiple protocols.
- Implication: Connext's stickiness depends on developer integration.
Influence of Large Users or Integrators
The bargaining power of customers can be substantial if large decentralized applications (dApps) or platforms integrate with Connext. These large users, with their significant transaction volumes or user bases, could exert considerable influence. They might negotiate favorable terms or fees due to the value they bring to the network. For example, in 2024, the top 10 dApps accounted for roughly 60% of total DeFi TVL, showing the concentration of power.
- Volume Leverage: High transaction volume gives customers negotiating leverage.
- Fee Sensitivity: Large users are highly sensitive to transaction fees.
- Integration Importance: Connext's success depends on attracting and retaining key integrators.
- Network Effects: Network effects amplify the impact of large customer decisions.
Bridge Battles: Customer Power in the Cross-Chain World
Connext's customers, including dApp developers and end-users, have strong bargaining power, with multiple bridge options available. Switching costs vary; end-users find it easy to switch, while developers face integration challenges. In 2024, cross-chain bridge transactions exceeded $50 billion, highlighting customer mobility.
| Customer Type | Switching Cost | Impact on Connext |
|---|---|---|
| End-users | Low | High churn risk |
| Developers | High | Stickiness through integration |
| Large dApps | High | Negotiating power |
Rivalry Among Competitors
Number and Diversity of Competitors
The blockchain interoperability sector sees intense competition, with numerous protocols vying for dominance. In 2024, the market included over 50 different interoperability solutions. This diversity fuels rivalry, pushing for innovation and lower fees.
Technological Approaches
Competitors in the interoperability space use diverse tech strategies, including bridging and Layer-2 solutions. This rivalry is fueled by the success, safety, and performance of these varied methods. For example, in 2024, the total value locked (TVL) in Layer-2 solutions exceeded $50 billion, showcasing the intense competition. The most secure and efficient tech gains market share.

Focus on Specific Niches
Some competitors may focus on specific niches within interoperability, such as particular blockchain ecosystems or types of assets. This strategic focus can segment the market. For example, in 2024, niche interoperability solutions targeting DeFi grew by 40%. Protocols compete for market share within these niches, intensifying rivalry. Smaller players can still pose a threat.
Innovation and Development Speed
Innovation in the blockchain sector is rapid, intensifying competitive rivalry. Connext faces constant pressure from rivals developing new features and bolstering security. This dynamic environment necessitates rapid adaptation to remain competitive. The blockchain market's growth, with a projected value of $94.4 billion in 2024, encourages aggressive innovation.
- New features and security upgrades are frequently released.
- Competitors are actively expanding into new blockchain networks.
- The need to stay ahead drives the pace of development.
- Market growth fuels the intensity of competition.
Funding and Partnerships
Competitors' funding and partnerships significantly shape their competitive edge. Strong financial backing allows for aggressive protocol development and extensive marketing. Strategic alliances provide access to crucial resources, accelerating growth within the market. In 2024, funding rounds for blockchain projects varied, with some securing millions. These investments fuel innovation and market penetration.
- Funding levels directly impact protocol development and market reach.
- Strategic partnerships provide access to essential resources and networks.
- Competitive dynamics are intensified by aggressive funding and alliances.
- Market share is often determined by investment and collaboration strategies.
Blockchain Interoperability: A Competitive Landscape
Competitive rivalry in the blockchain interoperability space is fierce, driven by innovation and market growth. Numerous protocols compete, using diverse tech and targeting various niches. Funding and partnerships significantly shape competitive dynamics, influencing market share.
| Aspect | Details | 2024 Data |
|---|---|---|
| Market Growth | Projected value of blockchain market | $94.4 billion |
| Layer-2 TVL | Total Value Locked in Layer-2 solutions | Exceeded $50 billion |
| DeFi Niche Growth | Growth in DeFi-focused interoperability solutions | 40% |
CONNEXT PORTER'S FIVE FORCES TEMPLATE RESEARCH
What is included in the product
Tailored exclusively for Connext, analyzing its position within its competitive landscape.
Customize pressure levels based on new data or evolving market trends.
What You See Is What You Get
Connext Porter's Five Forces Analysis
This preview reveals the complete Porter's Five Forces analysis for Connext. It's the identical, ready-to-use document you'll download instantly after purchase.
Porter's Five Forces Analysis Template
A Must-Have Tool for Decision-Makers
Connext faces a dynamic competitive landscape. Analyzing the threat of new entrants, supplier power, and buyer bargaining power is crucial for understanding its position. The intensity of rivalry and the threat of substitutes also significantly shape Connext's success. These forces determine profitability and strategic options.
Our full Porter's Five Forces report goes deeper—offering a data-driven framework to understand Connext's real business risks and market opportunities.
Suppliers Bargaining Power
Key Technology Providers
Connext's dependence on blockchain tech (Ethereum, EVM-compatible chains) and infrastructure providers gives these suppliers bargaining power. The cost of using Ethereum, for instance, can fluctuate significantly, impacting Connext's operational costs. Ethereum's average transaction fees in 2024 ranged from $1 to $100+, showing volatility. Changes in these providers' fees or services directly affect Connext's profitability and scalability.
Liquidity Providers (Routers)
Routers are essential liquidity providers in the Connext network, enabling transactions. Their bargaining power hinges on factors like router count and ease of entry. Fewer routers or high entry barriers amplify their influence.
Oracle Services
Connext uses oracle services for trustless communication and data transfer, relying on external data for its blockchain. The bargaining power of oracle providers like Chainlink, a major player, is significant. Chainlink's market capitalization in early 2024 was around $10 billion, showcasing its influence.
The uniqueness of their data feeds and the availability of alternatives affect this power. If Connext depends heavily on specialized data from a single oracle, that provider gains leverage. However, the presence of competitors and open-source solutions can reduce this power.
For example, the growth of decentralized oracle networks offers Connext more options. Competition keeps prices competitive. The dependence on specific oracle services will shape Connext's operational costs and flexibility, a key factor for 2024 and beyond.
Security and Auditing Services
Connext's reliance on security audits grants providers some bargaining power. These services are crucial for maintaining the protocol's integrity. The reputation of security firms directly impacts Connext's trustworthiness. High demand for top-tier auditors further strengthens their position. In 2024, the cybersecurity market is valued at over $200 billion, highlighting the significance of these services.
- Criticality of Security: Security audits are essential for an interoperability protocol's functionality.
- Reputation Matters: Expertise and reputation of providers directly affect Connext's credibility.
- Market Dynamics: High demand in the cybersecurity market enhances provider bargaining power.
- 2024 Market Value: Cybersecurity market exceeds $200 billion, emphasizing service importance.
Development Tool Providers
Connext relies on development tool providers, impacting its operations. The cost and accessibility of these tools affect Connext's ability to integrate with other dApps. Providers' pricing strategies and technological advancements are key factors. For example, the global market for software development tools was valued at $79.6 billion in 2023.
- Tool costs can significantly influence Connext's expenses.
- Availability of tools affects integration timelines.
- Provider innovation drives Connext's capabilities.
- Connext's dependence creates supplier power dynamics.
Blockchain's Grip on Operational Costs
Suppliers of blockchain tech, including Ethereum, wield substantial bargaining power over Connext, influencing its operational expenses. Router influence depends on their numbers and ease of network entry. Oracle providers like Chainlink, with a market cap around $10B in early 2024, also exert considerable power.
| Supplier Type | Bargaining Power Factor | 2024 Impact |
|---|---|---|
| Blockchain Infrastructure | Cost Volatility | Ethereum fees varied greatly, impacting costs. |
| Routers | Network Entry | Fewer routers increase influence. |
| Oracle Providers | Market Cap/Data Uniqueness | Chainlink's $10B cap gives leverage. |
Customers Bargaining Power
dApp Developers and Users
Connext's customers, dApp developers and users, wield significant bargaining power. They can choose from multiple interoperability solutions, including LayerZero and Wormhole. Switching costs are low, empowering them to demand competitive pricing and service quality. In 2024, the total value locked (TVL) in cross-chain bridges fluctuated, reflecting customer mobility. The sector saw over $50 billion in transactions in the first half of 2024.
Need for Seamless Cross-Chain Experience
Customers now expect easy and cheap cross-chain transactions. Connext's success depends on satisfying these needs. A recent report showed that cross-chain bridge usage surged by 300% in 2024. If Connext fails, users will switch to rivals. This shift affects Connext's market position and profitability.
Availability of Alternatives
Customers benefit from many interoperability choices. This includes protocols and bridges. Data from 2024 shows the rise of multiple chains. This increased customer bargaining power.
Switching Costs for Users and Developers
The bargaining power of customers regarding Connext Porter is complex, varying between end-users and developers. End-users, often using multiple wallets, face low switching costs. Developers, however, who have integrated Connext into their dApps, may incur higher costs to switch. These costs include re-engineering efforts and potential disruptions. Consider that in 2024, over 60% of blockchain developers use multiple protocols.
- End-users: Low switching costs due to multiple wallet usage.
- Developers: Higher switching costs due to integration efforts.
- Market Data: Over 60% of developers use multiple protocols.
- Implication: Connext's stickiness depends on developer integration.
Influence of Large Users or Integrators
The bargaining power of customers can be substantial if large decentralized applications (dApps) or platforms integrate with Connext. These large users, with their significant transaction volumes or user bases, could exert considerable influence. They might negotiate favorable terms or fees due to the value they bring to the network. For example, in 2024, the top 10 dApps accounted for roughly 60% of total DeFi TVL, showing the concentration of power.
- Volume Leverage: High transaction volume gives customers negotiating leverage.
- Fee Sensitivity: Large users are highly sensitive to transaction fees.
- Integration Importance: Connext's success depends on attracting and retaining key integrators.
- Network Effects: Network effects amplify the impact of large customer decisions.
Bridge Battles: Customer Power in the Cross-Chain World
Connext's customers, including dApp developers and end-users, have strong bargaining power, with multiple bridge options available. Switching costs vary; end-users find it easy to switch, while developers face integration challenges. In 2024, cross-chain bridge transactions exceeded $50 billion, highlighting customer mobility.
| Customer Type | Switching Cost | Impact on Connext |
|---|---|---|
| End-users | Low | High churn risk |
| Developers | High | Stickiness through integration |
| Large dApps | High | Negotiating power |
Rivalry Among Competitors
Number and Diversity of Competitors
The blockchain interoperability sector sees intense competition, with numerous protocols vying for dominance. In 2024, the market included over 50 different interoperability solutions. This diversity fuels rivalry, pushing for innovation and lower fees.
Technological Approaches
Competitors in the interoperability space use diverse tech strategies, including bridging and Layer-2 solutions. This rivalry is fueled by the success, safety, and performance of these varied methods. For example, in 2024, the total value locked (TVL) in Layer-2 solutions exceeded $50 billion, showcasing the intense competition. The most secure and efficient tech gains market share.
Focus on Specific Niches
Some competitors may focus on specific niches within interoperability, such as particular blockchain ecosystems or types of assets. This strategic focus can segment the market. For example, in 2024, niche interoperability solutions targeting DeFi grew by 40%. Protocols compete for market share within these niches, intensifying rivalry. Smaller players can still pose a threat.
Innovation and Development Speed
Innovation in the blockchain sector is rapid, intensifying competitive rivalry. Connext faces constant pressure from rivals developing new features and bolstering security. This dynamic environment necessitates rapid adaptation to remain competitive. The blockchain market's growth, with a projected value of $94.4 billion in 2024, encourages aggressive innovation.
- New features and security upgrades are frequently released.
- Competitors are actively expanding into new blockchain networks.
- The need to stay ahead drives the pace of development.
- Market growth fuels the intensity of competition.
Funding and Partnerships
Competitors' funding and partnerships significantly shape their competitive edge. Strong financial backing allows for aggressive protocol development and extensive marketing. Strategic alliances provide access to crucial resources, accelerating growth within the market. In 2024, funding rounds for blockchain projects varied, with some securing millions. These investments fuel innovation and market penetration.
- Funding levels directly impact protocol development and market reach.
- Strategic partnerships provide access to essential resources and networks.
- Competitive dynamics are intensified by aggressive funding and alliances.
- Market share is often determined by investment and collaboration strategies.
Blockchain Interoperability: A Competitive Landscape
Competitive rivalry in the blockchain interoperability space is fierce, driven by innovation and market growth. Numerous protocols compete, using diverse tech and targeting various niches. Funding and partnerships significantly shape competitive dynamics, influencing market share.
| Aspect | Details | 2024 Data |
|---|---|---|
| Market Growth | Projected value of blockchain market | $94.4 billion |
| Layer-2 TVL | Total Value Locked in Layer-2 solutions | Exceeded $50 billion |
| DeFi Niche Growth | Growth in DeFi-focused interoperability solutions | 40% |
Product Information
Product Information
Shipping & Returns
Shipping & Returns
Description
What is included in the product
Tailored exclusively for Connext, analyzing its position within its competitive landscape.
Customize pressure levels based on new data or evolving market trends.
What You See Is What You Get
Connext Porter's Five Forces Analysis
This preview reveals the complete Porter's Five Forces analysis for Connext. It's the identical, ready-to-use document you'll download instantly after purchase.
Porter's Five Forces Analysis Template
A Must-Have Tool for Decision-Makers
Connext faces a dynamic competitive landscape. Analyzing the threat of new entrants, supplier power, and buyer bargaining power is crucial for understanding its position. The intensity of rivalry and the threat of substitutes also significantly shape Connext's success. These forces determine profitability and strategic options.
Our full Porter's Five Forces report goes deeper—offering a data-driven framework to understand Connext's real business risks and market opportunities.
Suppliers Bargaining Power
Key Technology Providers
Connext's dependence on blockchain tech (Ethereum, EVM-compatible chains) and infrastructure providers gives these suppliers bargaining power. The cost of using Ethereum, for instance, can fluctuate significantly, impacting Connext's operational costs. Ethereum's average transaction fees in 2024 ranged from $1 to $100+, showing volatility. Changes in these providers' fees or services directly affect Connext's profitability and scalability.
Liquidity Providers (Routers)
Routers are essential liquidity providers in the Connext network, enabling transactions. Their bargaining power hinges on factors like router count and ease of entry. Fewer routers or high entry barriers amplify their influence.
Oracle Services
Connext uses oracle services for trustless communication and data transfer, relying on external data for its blockchain. The bargaining power of oracle providers like Chainlink, a major player, is significant. Chainlink's market capitalization in early 2024 was around $10 billion, showcasing its influence.
The uniqueness of their data feeds and the availability of alternatives affect this power. If Connext depends heavily on specialized data from a single oracle, that provider gains leverage. However, the presence of competitors and open-source solutions can reduce this power.
For example, the growth of decentralized oracle networks offers Connext more options. Competition keeps prices competitive. The dependence on specific oracle services will shape Connext's operational costs and flexibility, a key factor for 2024 and beyond.
Security and Auditing Services
Connext's reliance on security audits grants providers some bargaining power. These services are crucial for maintaining the protocol's integrity. The reputation of security firms directly impacts Connext's trustworthiness. High demand for top-tier auditors further strengthens their position. In 2024, the cybersecurity market is valued at over $200 billion, highlighting the significance of these services.
- Criticality of Security: Security audits are essential for an interoperability protocol's functionality.
- Reputation Matters: Expertise and reputation of providers directly affect Connext's credibility.
- Market Dynamics: High demand in the cybersecurity market enhances provider bargaining power.
- 2024 Market Value: Cybersecurity market exceeds $200 billion, emphasizing service importance.
Development Tool Providers
Connext relies on development tool providers, impacting its operations. The cost and accessibility of these tools affect Connext's ability to integrate with other dApps. Providers' pricing strategies and technological advancements are key factors. For example, the global market for software development tools was valued at $79.6 billion in 2023.
- Tool costs can significantly influence Connext's expenses.
- Availability of tools affects integration timelines.
- Provider innovation drives Connext's capabilities.
- Connext's dependence creates supplier power dynamics.
Blockchain's Grip on Operational Costs
Suppliers of blockchain tech, including Ethereum, wield substantial bargaining power over Connext, influencing its operational expenses. Router influence depends on their numbers and ease of network entry. Oracle providers like Chainlink, with a market cap around $10B in early 2024, also exert considerable power.
| Supplier Type | Bargaining Power Factor | 2024 Impact |
|---|---|---|
| Blockchain Infrastructure | Cost Volatility | Ethereum fees varied greatly, impacting costs. |
| Routers | Network Entry | Fewer routers increase influence. |
| Oracle Providers | Market Cap/Data Uniqueness | Chainlink's $10B cap gives leverage. |
Customers Bargaining Power
dApp Developers and Users
Connext's customers, dApp developers and users, wield significant bargaining power. They can choose from multiple interoperability solutions, including LayerZero and Wormhole. Switching costs are low, empowering them to demand competitive pricing and service quality. In 2024, the total value locked (TVL) in cross-chain bridges fluctuated, reflecting customer mobility. The sector saw over $50 billion in transactions in the first half of 2024.
Need for Seamless Cross-Chain Experience
Customers now expect easy and cheap cross-chain transactions. Connext's success depends on satisfying these needs. A recent report showed that cross-chain bridge usage surged by 300% in 2024. If Connext fails, users will switch to rivals. This shift affects Connext's market position and profitability.
Availability of Alternatives
Customers benefit from many interoperability choices. This includes protocols and bridges. Data from 2024 shows the rise of multiple chains. This increased customer bargaining power.
Switching Costs for Users and Developers
The bargaining power of customers regarding Connext Porter is complex, varying between end-users and developers. End-users, often using multiple wallets, face low switching costs. Developers, however, who have integrated Connext into their dApps, may incur higher costs to switch. These costs include re-engineering efforts and potential disruptions. Consider that in 2024, over 60% of blockchain developers use multiple protocols.
- End-users: Low switching costs due to multiple wallet usage.
- Developers: Higher switching costs due to integration efforts.
- Market Data: Over 60% of developers use multiple protocols.
- Implication: Connext's stickiness depends on developer integration.
Influence of Large Users or Integrators
The bargaining power of customers can be substantial if large decentralized applications (dApps) or platforms integrate with Connext. These large users, with their significant transaction volumes or user bases, could exert considerable influence. They might negotiate favorable terms or fees due to the value they bring to the network. For example, in 2024, the top 10 dApps accounted for roughly 60% of total DeFi TVL, showing the concentration of power.
- Volume Leverage: High transaction volume gives customers negotiating leverage.
- Fee Sensitivity: Large users are highly sensitive to transaction fees.
- Integration Importance: Connext's success depends on attracting and retaining key integrators.
- Network Effects: Network effects amplify the impact of large customer decisions.
Bridge Battles: Customer Power in the Cross-Chain World
Connext's customers, including dApp developers and end-users, have strong bargaining power, with multiple bridge options available. Switching costs vary; end-users find it easy to switch, while developers face integration challenges. In 2024, cross-chain bridge transactions exceeded $50 billion, highlighting customer mobility.
| Customer Type | Switching Cost | Impact on Connext |
|---|---|---|
| End-users | Low | High churn risk |
| Developers | High | Stickiness through integration |
| Large dApps | High | Negotiating power |
Rivalry Among Competitors
Number and Diversity of Competitors
The blockchain interoperability sector sees intense competition, with numerous protocols vying for dominance. In 2024, the market included over 50 different interoperability solutions. This diversity fuels rivalry, pushing for innovation and lower fees.
Technological Approaches
Competitors in the interoperability space use diverse tech strategies, including bridging and Layer-2 solutions. This rivalry is fueled by the success, safety, and performance of these varied methods. For example, in 2024, the total value locked (TVL) in Layer-2 solutions exceeded $50 billion, showcasing the intense competition. The most secure and efficient tech gains market share.
Focus on Specific Niches
Some competitors may focus on specific niches within interoperability, such as particular blockchain ecosystems or types of assets. This strategic focus can segment the market. For example, in 2024, niche interoperability solutions targeting DeFi grew by 40%. Protocols compete for market share within these niches, intensifying rivalry. Smaller players can still pose a threat.
Innovation and Development Speed
Innovation in the blockchain sector is rapid, intensifying competitive rivalry. Connext faces constant pressure from rivals developing new features and bolstering security. This dynamic environment necessitates rapid adaptation to remain competitive. The blockchain market's growth, with a projected value of $94.4 billion in 2024, encourages aggressive innovation.
- New features and security upgrades are frequently released.
- Competitors are actively expanding into new blockchain networks.
- The need to stay ahead drives the pace of development.
- Market growth fuels the intensity of competition.
Funding and Partnerships
Competitors' funding and partnerships significantly shape their competitive edge. Strong financial backing allows for aggressive protocol development and extensive marketing. Strategic alliances provide access to crucial resources, accelerating growth within the market. In 2024, funding rounds for blockchain projects varied, with some securing millions. These investments fuel innovation and market penetration.
- Funding levels directly impact protocol development and market reach.
- Strategic partnerships provide access to essential resources and networks.
- Competitive dynamics are intensified by aggressive funding and alliances.
- Market share is often determined by investment and collaboration strategies.
Blockchain Interoperability: A Competitive Landscape
Competitive rivalry in the blockchain interoperability space is fierce, driven by innovation and market growth. Numerous protocols compete, using diverse tech and targeting various niches. Funding and partnerships significantly shape competitive dynamics, influencing market share.
| Aspect | Details | 2024 Data |
|---|---|---|
| Market Growth | Projected value of blockchain market | $94.4 billion |
| Layer-2 TVL | Total Value Locked in Layer-2 solutions | Exceeded $50 billion |
| DeFi Niche Growth | Growth in DeFi-focused interoperability solutions | 40% |


