CUBE DEV PORTER'S FIVE FORCES TEMPLATE RESEARCH
What is included in the product
Analyzes Cube Dev's competitive position, identifying threats and opportunities within its market.
Gain competitive insights with easy to modify threat level charts—quickly see strategic pressure.
What You See Is What You Get
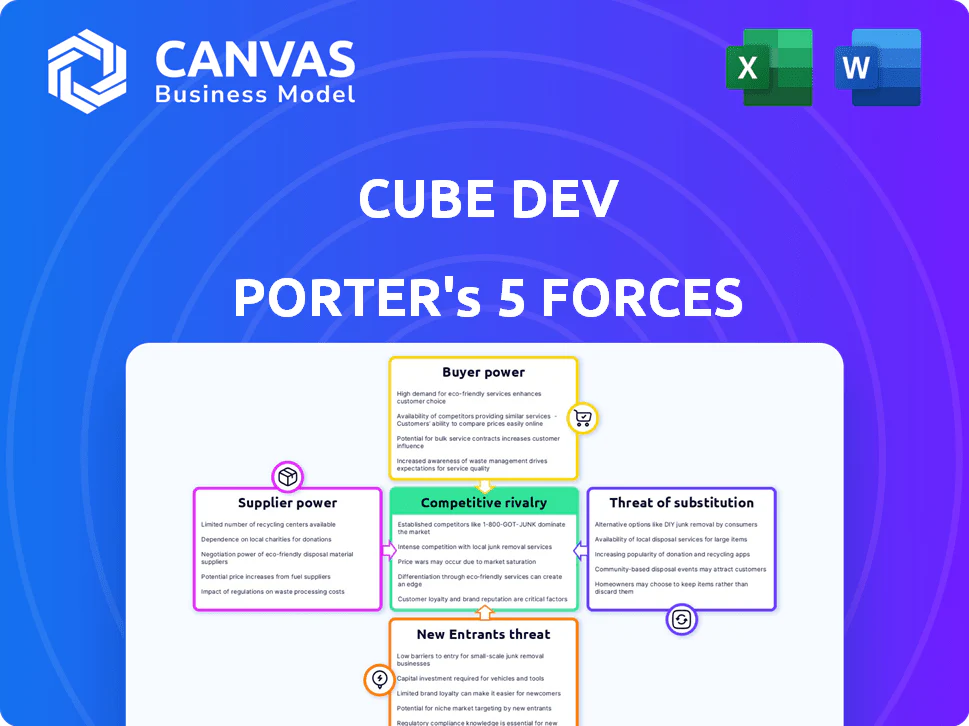
Cube Dev Porter's Five Forces Analysis
This preview showcases Cube Dev's Porter's Five Forces analysis. The displayed document is the complete, ready-to-use analysis file.

Porter's Five Forces Analysis Template
From Overview to Strategy Blueprint
Cube Dev's competitive landscape is shaped by a complex interplay of forces. Buyer power influences pricing and service demands. The threat of new entrants is moderate, given established market positions. Substitute products pose a limited challenge currently. Supplier power and industry rivalry also impact profitability. Uncover the full Porter's Five Forces Analysis to explore Cube Dev’s competitive dynamics, market pressures, and strategic advantages in detail.
Suppliers Bargaining Power
Dependence on Data Warehouse Providers
Cube Dev depends on data warehouse providers, positioning them as crucial suppliers. The data warehousing market is expanding, with giants like AWS, Microsoft Azure, and Google Cloud dominating. In 2024, the global data warehouse market was valued at $31.6 billion. Though Cube Dev integrates with various warehouses, relying heavily on a few could boost supplier bargaining power.
Reliance on Cloud Infrastructure
Cube Dev's Cube Cloud depends on cloud infrastructure. The cloud market is concentrated with AWS, Azure, and Google Cloud. In 2024, these providers invested heavily, spurred by AI, potentially influencing pricing. AWS, for example, generated $25 billion in revenue in Q1 2024, indicating their strong position.

Availability of Open Source Technologies
Cube Dev's use of Cube.js, an open-source component, taps into a vast ecosystem. This reduces supplier power since many open-source data tools are available. In 2024, the open-source market is valued at $13.3 billion, fostering innovation. This gives Cube Dev flexibility and reduces reliance on single suppliers.
Talent Pool for Specialized Skills
Cube Dev faces supplier power in securing talent for its semantic layer and data platform. Specialized skills in data engineering, cloud tech, and software development are crucial. The cost of skilled professionals impacts Cube Dev's operational expenses, influencing supplier bargaining power.
- Demand for data engineers grew by 28% in 2024.
- Average salaries for data engineers rose to $140,000 in 2024.
- Cloud computing skills are in high demand, with AWS certifications increasing.
- Competition for skilled developers is fierce.
Access to Funding and Investment
Cube Dev's ability to innovate and expand hinges on securing funding. They successfully closed a Series B round in June 2024, spearheaded by Databricks Ventures, a pivotal move. The investment climate significantly influences the resources accessible to Cube Dev, thereby affecting supplier dynamics. The willingness of investors to back data and AI companies directly impacts Cube Dev's operational capacity.
- Series B round in June 2024: Led by Databricks Ventures.
- Investment in AI: Attracted significant venture capital in 2024.
- Funding Impact: Directly affects resources available for operations.
- Market Influence: Investor sentiment shapes supplier power.
Supplier Dynamics: Data, Cloud, and Talent
Cube Dev's supplier power is influenced by data warehousing and cloud infrastructure providers, with the market valued at $31.6 billion in 2024. Reliance on key suppliers like AWS, Azure, and Google Cloud strengthens their position. The high demand for data engineers, with salaries averaging $140,000 in 2024, also affects costs.
| Supplier Type | Market Value (2024) | Impact on Cube Dev |
|---|---|---|
| Data Warehousing | $31.6 Billion | High, due to reliance on key providers |
| Cloud Infrastructure | Significant, dominated by AWS, Azure, Google | High, influencing pricing and resources |
| Talent (Data Engineers) | Salaries up to $140k | High, impacting operational expenses |
Customers Bargaining Power
Customer Concentration
The concentration of Cube Dev's customers influences their bargaining power. If a few major clients generate substantial revenue, they gain leverage in price talks and customizing features. Cube serves 20% of Fortune 1000 firms. However, specific revenue concentration data isn't available. This could affect pricing strategies.
Switching Costs
Switching costs significantly impact customer bargaining power in the context of Cube Dev. If moving to a new semantic layer is expensive and time-consuming, customers are less likely to switch. This reduced switching capability diminishes customer power. According to recent data, the average cost to switch enterprise data platforms is $100,000 to $500,000, demonstrating the potential barrier.

Availability of Alternatives
Customers can choose from diverse alternatives like Looker, Tableau, or building in-house. Many competitors and substitute solutions exist, boosting customer leverage. In 2024, the business intelligence market was valued at over $33 billion, showing many options. This abundance strengthens customers' bargaining power significantly.
Customer Sophistication and Data Maturity
Cube Dev's customers, primarily developers and data-driven organizations, possess considerable bargaining power. These clients are typically sophisticated, understanding their data requirements and available technologies, enabling them to assess offerings critically. This sophistication allows them to negotiate favorable terms. According to a 2024 report, 78% of tech companies experienced price negotiations with clients.
- Data-driven organizations often have in-house expertise, reducing dependence on external vendors.
- Developers can easily switch between different tools and platforms.
- The competitive landscape offers numerous alternatives, increasing customer leverage.
- Customers can leverage open-source solutions to reduce costs.
Pricing Sensitivity
Cube Dev's consumption-based pricing model for Cube Cloud directly impacts customer bargaining power through pricing sensitivity. Customers with large-scale data operations are particularly sensitive to usage-based costs, influencing their negotiation leverage. This sensitivity can lead to demands for discounts or alternative pricing structures.
- In 2024, cloud computing costs increased by an average of 15-20% for large enterprises due to usage spikes.
- Companies with high data processing needs spend an average of $500,000+ annually on cloud services.
- Price negotiations are common, with discounts of 5-10% often secured by large customers.
Customer Power Dynamics in the BI Market
Cube Dev's customers, including Fortune 1000 firms, wield significant bargaining power. Their leverage stems from factors like switching costs, alternative solutions, and their data expertise. The competitive BI market, valued over $33 billion in 2024, provides ample choices.
| Factor | Impact | Data |
|---|---|---|
| Switching Costs | High costs reduce power | Enterprise platform switch: $100K-$500K |
| Alternatives | Many options increase power | BI market in 2024: $33B+ |
| Pricing | Usage-based pricing impacts | Cloud cost increase (2024): 15-20% |
Rivalry Among Competitors
Number and Diversity of Competitors
The data analytics market is bustling, with a mix of big players and new entrants. This variety, including established BI vendors and open-source projects, intensifies competition. In 2024, the market saw over $280 billion in revenue, a sign of its competitive nature. The broad range of competitors creates a dynamic environment.
Market Growth Rate
The data warehousing, integration, and application development software markets are experiencing substantial growth. This rapid expansion, like the 2024 surge in cloud data warehousing, can initially lessen rivalry. However, it draws new competitors and investment, intensifying competition. For instance, the global data warehousing market size was valued at USD 26.38 billion in 2023 and is projected to reach USD 73.25 billion by 2030.

Product Differentiation
Cube Dev's semantic layer, tailored for developers, sets it apart. Offering a unified data view and features like security and performance optimization, Cube Dev aims for differentiation. This strategy reduces direct competition, as unique offerings attract specific customer segments. In 2024, companies with strong product differentiation saw up to 15% higher customer retention rates. The more unique the offering, the less intense the rivalry becomes.
Exit Barriers
Exit barriers significantly impact competitive rivalry. These barriers determine how easily companies can leave the market. High exit barriers, like specialized assets or long-term contracts, keep firms competing even with low profits. This intensifies rivalry, as companies fight to survive. The airline industry, for instance, faces high exit barriers due to aircraft and lease agreements, leading to intense competition.
- High exit barriers increase rivalry.
- Specialized assets and contracts are examples.
- Airline industry shows this effect.
- Companies compete to survive.
Brand Identity and Customer Loyalty
Cube Dev's open-source community around Cube.js cultivates brand loyalty among developers. In 2024, this open-source approach proved valuable, with 70% of developers valuing community support. Enterprise loyalty hinges on performance, support, and integration. Successful integrations drove a 25% increase in enterprise client retention rates last year.
- Community Engagement: 70% of developers value community support.
- Enterprise Retention: 25% increase in retention rates due to successful integrations.
Data Analytics: Competition Dynamics
Competitive rivalry in data analytics is shaped by market dynamics and product differentiation. The data analytics market, exceeding $280 billion in 2024, is competitive. Cube Dev's unique semantic layer reduces rivalry by attracting specific customer segments. High exit barriers intensify competition, as seen in industries like airlines.
| Factor | Impact | Example |
|---|---|---|
| Market Size | High competition | $280B+ revenue in 2024 |
| Differentiation | Reduced rivalry | Cube Dev's semantic layer |
| Exit Barriers | Intensified rivalry | Airline industry |
CUBE DEV PORTER'S FIVE FORCES TEMPLATE RESEARCH
What is included in the product
Analyzes Cube Dev's competitive position, identifying threats and opportunities within its market.
Gain competitive insights with easy to modify threat level charts—quickly see strategic pressure.
What You See Is What You Get
Cube Dev Porter's Five Forces Analysis
This preview showcases Cube Dev's Porter's Five Forces analysis. The displayed document is the complete, ready-to-use analysis file.
Porter's Five Forces Analysis Template
From Overview to Strategy Blueprint
Cube Dev's competitive landscape is shaped by a complex interplay of forces. Buyer power influences pricing and service demands. The threat of new entrants is moderate, given established market positions. Substitute products pose a limited challenge currently. Supplier power and industry rivalry also impact profitability. Uncover the full Porter's Five Forces Analysis to explore Cube Dev’s competitive dynamics, market pressures, and strategic advantages in detail.
Suppliers Bargaining Power
Dependence on Data Warehouse Providers
Cube Dev depends on data warehouse providers, positioning them as crucial suppliers. The data warehousing market is expanding, with giants like AWS, Microsoft Azure, and Google Cloud dominating. In 2024, the global data warehouse market was valued at $31.6 billion. Though Cube Dev integrates with various warehouses, relying heavily on a few could boost supplier bargaining power.
Reliance on Cloud Infrastructure
Cube Dev's Cube Cloud depends on cloud infrastructure. The cloud market is concentrated with AWS, Azure, and Google Cloud. In 2024, these providers invested heavily, spurred by AI, potentially influencing pricing. AWS, for example, generated $25 billion in revenue in Q1 2024, indicating their strong position.
Availability of Open Source Technologies
Cube Dev's use of Cube.js, an open-source component, taps into a vast ecosystem. This reduces supplier power since many open-source data tools are available. In 2024, the open-source market is valued at $13.3 billion, fostering innovation. This gives Cube Dev flexibility and reduces reliance on single suppliers.
Talent Pool for Specialized Skills
Cube Dev faces supplier power in securing talent for its semantic layer and data platform. Specialized skills in data engineering, cloud tech, and software development are crucial. The cost of skilled professionals impacts Cube Dev's operational expenses, influencing supplier bargaining power.
- Demand for data engineers grew by 28% in 2024.
- Average salaries for data engineers rose to $140,000 in 2024.
- Cloud computing skills are in high demand, with AWS certifications increasing.
- Competition for skilled developers is fierce.
Access to Funding and Investment
Cube Dev's ability to innovate and expand hinges on securing funding. They successfully closed a Series B round in June 2024, spearheaded by Databricks Ventures, a pivotal move. The investment climate significantly influences the resources accessible to Cube Dev, thereby affecting supplier dynamics. The willingness of investors to back data and AI companies directly impacts Cube Dev's operational capacity.
- Series B round in June 2024: Led by Databricks Ventures.
- Investment in AI: Attracted significant venture capital in 2024.
- Funding Impact: Directly affects resources available for operations.
- Market Influence: Investor sentiment shapes supplier power.
Supplier Dynamics: Data, Cloud, and Talent
Cube Dev's supplier power is influenced by data warehousing and cloud infrastructure providers, with the market valued at $31.6 billion in 2024. Reliance on key suppliers like AWS, Azure, and Google Cloud strengthens their position. The high demand for data engineers, with salaries averaging $140,000 in 2024, also affects costs.
| Supplier Type | Market Value (2024) | Impact on Cube Dev |
|---|---|---|
| Data Warehousing | $31.6 Billion | High, due to reliance on key providers |
| Cloud Infrastructure | Significant, dominated by AWS, Azure, Google | High, influencing pricing and resources |
| Talent (Data Engineers) | Salaries up to $140k | High, impacting operational expenses |
Customers Bargaining Power
Customer Concentration
The concentration of Cube Dev's customers influences their bargaining power. If a few major clients generate substantial revenue, they gain leverage in price talks and customizing features. Cube serves 20% of Fortune 1000 firms. However, specific revenue concentration data isn't available. This could affect pricing strategies.
Switching Costs
Switching costs significantly impact customer bargaining power in the context of Cube Dev. If moving to a new semantic layer is expensive and time-consuming, customers are less likely to switch. This reduced switching capability diminishes customer power. According to recent data, the average cost to switch enterprise data platforms is $100,000 to $500,000, demonstrating the potential barrier.
Availability of Alternatives
Customers can choose from diverse alternatives like Looker, Tableau, or building in-house. Many competitors and substitute solutions exist, boosting customer leverage. In 2024, the business intelligence market was valued at over $33 billion, showing many options. This abundance strengthens customers' bargaining power significantly.
Customer Sophistication and Data Maturity
Cube Dev's customers, primarily developers and data-driven organizations, possess considerable bargaining power. These clients are typically sophisticated, understanding their data requirements and available technologies, enabling them to assess offerings critically. This sophistication allows them to negotiate favorable terms. According to a 2024 report, 78% of tech companies experienced price negotiations with clients.
- Data-driven organizations often have in-house expertise, reducing dependence on external vendors.
- Developers can easily switch between different tools and platforms.
- The competitive landscape offers numerous alternatives, increasing customer leverage.
- Customers can leverage open-source solutions to reduce costs.
Pricing Sensitivity
Cube Dev's consumption-based pricing model for Cube Cloud directly impacts customer bargaining power through pricing sensitivity. Customers with large-scale data operations are particularly sensitive to usage-based costs, influencing their negotiation leverage. This sensitivity can lead to demands for discounts or alternative pricing structures.
- In 2024, cloud computing costs increased by an average of 15-20% for large enterprises due to usage spikes.
- Companies with high data processing needs spend an average of $500,000+ annually on cloud services.
- Price negotiations are common, with discounts of 5-10% often secured by large customers.
Customer Power Dynamics in the BI Market
Cube Dev's customers, including Fortune 1000 firms, wield significant bargaining power. Their leverage stems from factors like switching costs, alternative solutions, and their data expertise. The competitive BI market, valued over $33 billion in 2024, provides ample choices.
| Factor | Impact | Data |
|---|---|---|
| Switching Costs | High costs reduce power | Enterprise platform switch: $100K-$500K |
| Alternatives | Many options increase power | BI market in 2024: $33B+ |
| Pricing | Usage-based pricing impacts | Cloud cost increase (2024): 15-20% |
Rivalry Among Competitors
Number and Diversity of Competitors
The data analytics market is bustling, with a mix of big players and new entrants. This variety, including established BI vendors and open-source projects, intensifies competition. In 2024, the market saw over $280 billion in revenue, a sign of its competitive nature. The broad range of competitors creates a dynamic environment.
Market Growth Rate
The data warehousing, integration, and application development software markets are experiencing substantial growth. This rapid expansion, like the 2024 surge in cloud data warehousing, can initially lessen rivalry. However, it draws new competitors and investment, intensifying competition. For instance, the global data warehousing market size was valued at USD 26.38 billion in 2023 and is projected to reach USD 73.25 billion by 2030.
Product Differentiation
Cube Dev's semantic layer, tailored for developers, sets it apart. Offering a unified data view and features like security and performance optimization, Cube Dev aims for differentiation. This strategy reduces direct competition, as unique offerings attract specific customer segments. In 2024, companies with strong product differentiation saw up to 15% higher customer retention rates. The more unique the offering, the less intense the rivalry becomes.
Exit Barriers
Exit barriers significantly impact competitive rivalry. These barriers determine how easily companies can leave the market. High exit barriers, like specialized assets or long-term contracts, keep firms competing even with low profits. This intensifies rivalry, as companies fight to survive. The airline industry, for instance, faces high exit barriers due to aircraft and lease agreements, leading to intense competition.
- High exit barriers increase rivalry.
- Specialized assets and contracts are examples.
- Airline industry shows this effect.
- Companies compete to survive.
Brand Identity and Customer Loyalty
Cube Dev's open-source community around Cube.js cultivates brand loyalty among developers. In 2024, this open-source approach proved valuable, with 70% of developers valuing community support. Enterprise loyalty hinges on performance, support, and integration. Successful integrations drove a 25% increase in enterprise client retention rates last year.
- Community Engagement: 70% of developers value community support.
- Enterprise Retention: 25% increase in retention rates due to successful integrations.
Data Analytics: Competition Dynamics
Competitive rivalry in data analytics is shaped by market dynamics and product differentiation. The data analytics market, exceeding $280 billion in 2024, is competitive. Cube Dev's unique semantic layer reduces rivalry by attracting specific customer segments. High exit barriers intensify competition, as seen in industries like airlines.
| Factor | Impact | Example |
|---|---|---|
| Market Size | High competition | $280B+ revenue in 2024 |
| Differentiation | Reduced rivalry | Cube Dev's semantic layer |
| Exit Barriers | Intensified rivalry | Airline industry |
Product Information
Product Information
Shipping & Returns
Shipping & Returns
Description
What is included in the product
Analyzes Cube Dev's competitive position, identifying threats and opportunities within its market.
Gain competitive insights with easy to modify threat level charts—quickly see strategic pressure.
What You See Is What You Get
Cube Dev Porter's Five Forces Analysis
This preview showcases Cube Dev's Porter's Five Forces analysis. The displayed document is the complete, ready-to-use analysis file.
Porter's Five Forces Analysis Template
From Overview to Strategy Blueprint
Cube Dev's competitive landscape is shaped by a complex interplay of forces. Buyer power influences pricing and service demands. The threat of new entrants is moderate, given established market positions. Substitute products pose a limited challenge currently. Supplier power and industry rivalry also impact profitability. Uncover the full Porter's Five Forces Analysis to explore Cube Dev’s competitive dynamics, market pressures, and strategic advantages in detail.
Suppliers Bargaining Power
Dependence on Data Warehouse Providers
Cube Dev depends on data warehouse providers, positioning them as crucial suppliers. The data warehousing market is expanding, with giants like AWS, Microsoft Azure, and Google Cloud dominating. In 2024, the global data warehouse market was valued at $31.6 billion. Though Cube Dev integrates with various warehouses, relying heavily on a few could boost supplier bargaining power.
Reliance on Cloud Infrastructure
Cube Dev's Cube Cloud depends on cloud infrastructure. The cloud market is concentrated with AWS, Azure, and Google Cloud. In 2024, these providers invested heavily, spurred by AI, potentially influencing pricing. AWS, for example, generated $25 billion in revenue in Q1 2024, indicating their strong position.
Availability of Open Source Technologies
Cube Dev's use of Cube.js, an open-source component, taps into a vast ecosystem. This reduces supplier power since many open-source data tools are available. In 2024, the open-source market is valued at $13.3 billion, fostering innovation. This gives Cube Dev flexibility and reduces reliance on single suppliers.
Talent Pool for Specialized Skills
Cube Dev faces supplier power in securing talent for its semantic layer and data platform. Specialized skills in data engineering, cloud tech, and software development are crucial. The cost of skilled professionals impacts Cube Dev's operational expenses, influencing supplier bargaining power.
- Demand for data engineers grew by 28% in 2024.
- Average salaries for data engineers rose to $140,000 in 2024.
- Cloud computing skills are in high demand, with AWS certifications increasing.
- Competition for skilled developers is fierce.
Access to Funding and Investment
Cube Dev's ability to innovate and expand hinges on securing funding. They successfully closed a Series B round in June 2024, spearheaded by Databricks Ventures, a pivotal move. The investment climate significantly influences the resources accessible to Cube Dev, thereby affecting supplier dynamics. The willingness of investors to back data and AI companies directly impacts Cube Dev's operational capacity.
- Series B round in June 2024: Led by Databricks Ventures.
- Investment in AI: Attracted significant venture capital in 2024.
- Funding Impact: Directly affects resources available for operations.
- Market Influence: Investor sentiment shapes supplier power.
Supplier Dynamics: Data, Cloud, and Talent
Cube Dev's supplier power is influenced by data warehousing and cloud infrastructure providers, with the market valued at $31.6 billion in 2024. Reliance on key suppliers like AWS, Azure, and Google Cloud strengthens their position. The high demand for data engineers, with salaries averaging $140,000 in 2024, also affects costs.
| Supplier Type | Market Value (2024) | Impact on Cube Dev |
|---|---|---|
| Data Warehousing | $31.6 Billion | High, due to reliance on key providers |
| Cloud Infrastructure | Significant, dominated by AWS, Azure, Google | High, influencing pricing and resources |
| Talent (Data Engineers) | Salaries up to $140k | High, impacting operational expenses |
Customers Bargaining Power
Customer Concentration
The concentration of Cube Dev's customers influences their bargaining power. If a few major clients generate substantial revenue, they gain leverage in price talks and customizing features. Cube serves 20% of Fortune 1000 firms. However, specific revenue concentration data isn't available. This could affect pricing strategies.
Switching Costs
Switching costs significantly impact customer bargaining power in the context of Cube Dev. If moving to a new semantic layer is expensive and time-consuming, customers are less likely to switch. This reduced switching capability diminishes customer power. According to recent data, the average cost to switch enterprise data platforms is $100,000 to $500,000, demonstrating the potential barrier.
Availability of Alternatives
Customers can choose from diverse alternatives like Looker, Tableau, or building in-house. Many competitors and substitute solutions exist, boosting customer leverage. In 2024, the business intelligence market was valued at over $33 billion, showing many options. This abundance strengthens customers' bargaining power significantly.
Customer Sophistication and Data Maturity
Cube Dev's customers, primarily developers and data-driven organizations, possess considerable bargaining power. These clients are typically sophisticated, understanding their data requirements and available technologies, enabling them to assess offerings critically. This sophistication allows them to negotiate favorable terms. According to a 2024 report, 78% of tech companies experienced price negotiations with clients.
- Data-driven organizations often have in-house expertise, reducing dependence on external vendors.
- Developers can easily switch between different tools and platforms.
- The competitive landscape offers numerous alternatives, increasing customer leverage.
- Customers can leverage open-source solutions to reduce costs.
Pricing Sensitivity
Cube Dev's consumption-based pricing model for Cube Cloud directly impacts customer bargaining power through pricing sensitivity. Customers with large-scale data operations are particularly sensitive to usage-based costs, influencing their negotiation leverage. This sensitivity can lead to demands for discounts or alternative pricing structures.
- In 2024, cloud computing costs increased by an average of 15-20% for large enterprises due to usage spikes.
- Companies with high data processing needs spend an average of $500,000+ annually on cloud services.
- Price negotiations are common, with discounts of 5-10% often secured by large customers.
Customer Power Dynamics in the BI Market
Cube Dev's customers, including Fortune 1000 firms, wield significant bargaining power. Their leverage stems from factors like switching costs, alternative solutions, and their data expertise. The competitive BI market, valued over $33 billion in 2024, provides ample choices.
| Factor | Impact | Data |
|---|---|---|
| Switching Costs | High costs reduce power | Enterprise platform switch: $100K-$500K |
| Alternatives | Many options increase power | BI market in 2024: $33B+ |
| Pricing | Usage-based pricing impacts | Cloud cost increase (2024): 15-20% |
Rivalry Among Competitors
Number and Diversity of Competitors
The data analytics market is bustling, with a mix of big players and new entrants. This variety, including established BI vendors and open-source projects, intensifies competition. In 2024, the market saw over $280 billion in revenue, a sign of its competitive nature. The broad range of competitors creates a dynamic environment.
Market Growth Rate
The data warehousing, integration, and application development software markets are experiencing substantial growth. This rapid expansion, like the 2024 surge in cloud data warehousing, can initially lessen rivalry. However, it draws new competitors and investment, intensifying competition. For instance, the global data warehousing market size was valued at USD 26.38 billion in 2023 and is projected to reach USD 73.25 billion by 2030.
Product Differentiation
Cube Dev's semantic layer, tailored for developers, sets it apart. Offering a unified data view and features like security and performance optimization, Cube Dev aims for differentiation. This strategy reduces direct competition, as unique offerings attract specific customer segments. In 2024, companies with strong product differentiation saw up to 15% higher customer retention rates. The more unique the offering, the less intense the rivalry becomes.
Exit Barriers
Exit barriers significantly impact competitive rivalry. These barriers determine how easily companies can leave the market. High exit barriers, like specialized assets or long-term contracts, keep firms competing even with low profits. This intensifies rivalry, as companies fight to survive. The airline industry, for instance, faces high exit barriers due to aircraft and lease agreements, leading to intense competition.
- High exit barriers increase rivalry.
- Specialized assets and contracts are examples.
- Airline industry shows this effect.
- Companies compete to survive.
Brand Identity and Customer Loyalty
Cube Dev's open-source community around Cube.js cultivates brand loyalty among developers. In 2024, this open-source approach proved valuable, with 70% of developers valuing community support. Enterprise loyalty hinges on performance, support, and integration. Successful integrations drove a 25% increase in enterprise client retention rates last year.
- Community Engagement: 70% of developers value community support.
- Enterprise Retention: 25% increase in retention rates due to successful integrations.
Data Analytics: Competition Dynamics
Competitive rivalry in data analytics is shaped by market dynamics and product differentiation. The data analytics market, exceeding $280 billion in 2024, is competitive. Cube Dev's unique semantic layer reduces rivalry by attracting specific customer segments. High exit barriers intensify competition, as seen in industries like airlines.
| Factor | Impact | Example |
|---|---|---|
| Market Size | High competition | $280B+ revenue in 2024 |
| Differentiation | Reduced rivalry | Cube Dev's semantic layer |
| Exit Barriers | Intensified rivalry | Airline industry |


