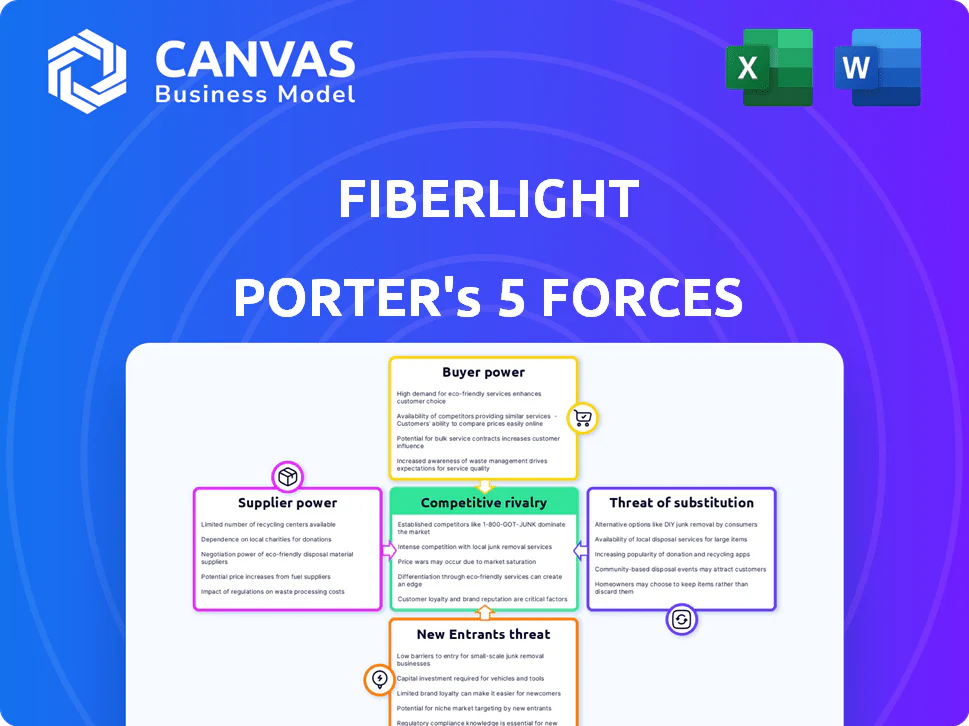
FIBERLIGHT PORTER'S FIVE FORCES TEMPLATE RESEARCH
What is included in the product
Analyzes FiberLight's position, identifying threats, market dynamics, and control by suppliers and buyers.
Spot competitive threats with clear force ratings and understand the impact on your business.
Full Version Awaits
FiberLight Porter's Five Forces Analysis
This preview showcases the full FiberLight Porter's Five Forces analysis. It provides an in-depth evaluation of industry competition, potential threats, and opportunities. The document details the company's competitive landscape, market dynamics, and strategic positioning. You're viewing the exact document you'll receive—fully formatted and ready to use.

Porter's Five Forces Analysis Template
Elevate Your Analysis with the Complete Porter's Five Forces Analysis
FiberLight faces moderate rivalry within the fiber-optic infrastructure market, with established players and aggressive pricing strategies. Buyer power is also moderate, as enterprise clients have some negotiating leverage. The threat of new entrants is low due to high capital requirements and regulatory hurdles. Supplier power from equipment manufacturers is moderate. The threat of substitutes, such as wireless solutions, presents a growing, though still limited, challenge.
The complete report reveals the real forces shaping FiberLight’s industry—from supplier influence to threat of new entrants. Gain actionable insights to drive smarter decision-making.
Suppliers Bargaining Power
Limited Number of Specialized Suppliers
The fiber optic cable market is dominated by a few specialized suppliers. This concentration, including companies like Corning, gives them pricing power. In 2024, Corning reported over $14 billion in sales. This market dynamic affects FiberLight's costs and supply chain.
High Switching Costs for Fiber Optic Infrastructure
FiberLight faces high switching costs. Changing suppliers for fiber optic components is expensive. Compatibility issues and network integration challenges arise. This dependence on existing suppliers increases their bargaining power. In 2024, the average cost to replace fiber optic infrastructure was $15,000 per mile.

Proprietary Technology and Patents
FiberLight faces supplier power when unique tech or patents are held, like advanced fiber optic cables. In 2024, specialized components can have limited sources. This scarcity boosts supplier influence. For example, a key patent holder could command higher prices.
Increasing Demand for Fiber Optic Components
The surge in global demand for high-speed internet, 5G, and data center expansion boosts demand for fiber optic components. This increased demand can strengthen supplier power, potentially leading to higher prices. Suppliers might gain leverage in negotiations due to this demand. Fiber optic cable market was valued at $9.7 billion in 2024.
- Global fiber optic cable market size was estimated at USD 9.7 billion in 2024.
- The market is projected to reach USD 16.7 billion by 2029.
- This represents a CAGR of 11.50% between 2024 and 2029.
- Data center expansion is a major driver.
Vertical Integration of Suppliers
FiberLight faces supplier power, particularly from vertically integrated firms in the fiber optic market. These suppliers, involved in raw materials, cable production, and network solutions, wield significant influence. Their control over the supply chain can affect FiberLight's costs and service delivery capabilities. This poses a risk to FiberLight's profitability and operational efficiency.
- Vertically integrated suppliers control a significant portion of the fiber optic market.
- FiberLight's dependence on these suppliers could lead to increased costs.
- Supplier control affects FiberLight's pricing strategies.
FiberLight's Supplier Power: High Costs & Market Dynamics
FiberLight's supplier bargaining power is high due to market concentration and specialized components. Switching costs and tech dependencies amplify this power. The booming demand for fiber optic components further strengthens suppliers. The global market was $9.7B in 2024, growing at 11.50% CAGR.
| Aspect | Impact on FiberLight | 2024 Data Points |
|---|---|---|
| Market Concentration | Limited supplier options, higher prices | Corning sales: $14B |
| Switching Costs | High costs to change suppliers | $15,000/mile for infra replacement |
| Demand Growth | Increased supplier leverage | Global market: $9.7B |
Customers Bargaining Power
Diverse Customer Base
FiberLight's diverse customer base—spanning enterprises, carriers, governments, and service providers—lessens customer bargaining power. This broad reach prevents any single client group from dominating pricing or service terms. For instance, in 2024, FiberLight's revenue was split across various sectors, no single client accounted for over 15% of sales. This distribution protects against undue customer influence.
Importance of Reliable and Scalable Infrastructure
FiberLight's enterprise and carrier clients depend on its fiber optic networks for critical data transmission. This reliance makes them less price-sensitive. In 2024, the demand for high-bandwidth services increased by 15%. Quality and reliability are key, potentially reducing their bargaining power.

Availability of Alternative Providers in Some Regions
FiberLight faces customer bargaining power where alternatives exist. In regions served by competitors like Zayo or Crown Castle, customers can negotiate better terms. For example, Zayo reported $2.67B in revenue in 2023, indicating strong market presence. This competition limits FiberLight's pricing flexibility.
Customer Sophistication and Technical Expertise
FiberLight's target customers, including carriers and large enterprises, are sophisticated buyers. These customers possess considerable technical expertise and a deep understanding of network technologies. This allows them to assess various offerings effectively, strengthening their negotiating position. In 2024, the average contract size for enterprise fiber optic services was approximately $250,000.
- Sophisticated buyers drive competitive pricing.
- Technical expertise enables informed decisions.
- Negotiating power is enhanced by evaluation skills.
- Average enterprise contract size: $250,000 (2024).
Potential for Customers to Build Their Own Infrastructure
Some major customers, like large tech firms or telecom companies, could opt to construct their own fiber optic networks. This strategy, known as vertical integration, lets them bypass FiberLight's services. This option becomes more appealing when dealing with specialized needs or high-volume data transfers. Building their own infrastructure can thus limit FiberLight's ability to set prices. For example, in 2024, vertical integration accounted for approximately 10-15% of network infrastructure decisions among Fortune 500 companies.
- Cost Savings: Building in-house might offer long-term cost benefits for high-bandwidth users.
- Control: Direct ownership provides greater control over network design and operations.
- Specificity: Customized networks can be tailored to unique business requirements.
- Market Data: In 2024, the average cost to deploy a new fiber mile was $40,000-$60,000.
Customer Bargaining Power: A Balanced View
FiberLight's customer bargaining power is moderate due to a diverse client base. Large enterprise and carrier clients' dependence on its services reduces their price sensitivity. However, competition and sophisticated buyers can enhance negotiation abilities.
| Factor | Impact | Data (2024) |
|---|---|---|
| Customer Diversity | Reduces bargaining power | No single client > 15% of sales |
| Service Dependence | Less price sensitivity | High-bandwidth demand up 15% |
| Competition | Increases bargaining power | Zayo's $2.67B revenue (2023) |
| Buyer Sophistication | Enhances negotiation | Avg. contract size $250,000 |
Rivalry Among Competitors
Presence of Multiple Fiber Optic Network Providers
The fiber optic network market features intense rivalry due to numerous providers, including national and regional players. This scenario escalates competition, especially for services like dark fiber and lit services. In 2024, major players like Lumen and Verizon invested billions to expand their fiber networks. This competition drives down prices and increases service options for businesses.
Competition on Price and Service Offerings
FiberLight faces intense competition from providers like Lumen and Zayo, who offer similar services. They compete on price, network reach, and bandwidth. In 2024, the fiber-optic services market saw significant price wars as providers vied for market share. This dynamic necessitates continuous service improvements.

Market Consolidation and Expansion
The telecom sector, including fiber optic network providers, is seeing consolidation via mergers and acquisitions. This leads to larger, more powerful competitors. For example, in 2024, there were several significant M&A deals. This increases competitive pressure. This includes expanded network footprints and resources.
Technological Advancements and Innovation
Technological advancements in fiber optic technology, like increased bandwidth and deployment methods, necessitate ongoing investment and innovation. Companies must continually adapt to stay competitive, fueling rivalry. The fiber optic cable market was valued at USD 9.8 billion in 2023. The adoption of 5G is driving demand for faster data transmission. This environment fosters intense competition among providers.
- Market size of fiber optic cable in 2023 was USD 9.8 billion.
- 5G adoption fuels demand for faster data transmission.
- Continuous investment and innovation are essential.
- Competition is high among fiber optic providers.
Regional Market Dynamics
Competitive rivalry for FiberLight hinges on regional market dynamics. Areas with dense fiber networks see fiercer competition, potentially squeezing margins. Conversely, underserved regions offer less rivalry, potentially leading to higher pricing power. FiberLight's market share in the Southeast, for example, is around 10%, indicating substantial competition. The varying competitive landscape requires tailored strategies for each region.
- Market share variations impact competitive intensity.
- Underserved areas offer growth opportunities.
- Pricing and service differentiation are key strategies.
- Regional market analysis is crucial for strategy.
Fiber Optic Market Heats Up: Competition Intensifies!
FiberLight faces intense competition in the fiber optic market, especially from major players like Lumen and Zayo. This rivalry is driven by factors such as price wars and the need for continuous service improvements. Consolidation through mergers and acquisitions further intensifies competition by creating larger rivals. Technological advancements and regional market dynamics also play a crucial role in shaping the competitive landscape.
| Metric | Value (2024) | Impact |
|---|---|---|
| Fiber Optic Market Growth | ~8% | Increased competition for market share |
| Average Price Decline | 5-7% | Pressure on profit margins |
| M&A Activity | Significant | Increased market concentration |
FIBERLIGHT PORTER'S FIVE FORCES TEMPLATE RESEARCH
What is included in the product
Analyzes FiberLight's position, identifying threats, market dynamics, and control by suppliers and buyers.
Spot competitive threats with clear force ratings and understand the impact on your business.
Full Version Awaits
FiberLight Porter's Five Forces Analysis
This preview showcases the full FiberLight Porter's Five Forces analysis. It provides an in-depth evaluation of industry competition, potential threats, and opportunities. The document details the company's competitive landscape, market dynamics, and strategic positioning. You're viewing the exact document you'll receive—fully formatted and ready to use.
Porter's Five Forces Analysis Template
Elevate Your Analysis with the Complete Porter's Five Forces Analysis
FiberLight faces moderate rivalry within the fiber-optic infrastructure market, with established players and aggressive pricing strategies. Buyer power is also moderate, as enterprise clients have some negotiating leverage. The threat of new entrants is low due to high capital requirements and regulatory hurdles. Supplier power from equipment manufacturers is moderate. The threat of substitutes, such as wireless solutions, presents a growing, though still limited, challenge.
The complete report reveals the real forces shaping FiberLight’s industry—from supplier influence to threat of new entrants. Gain actionable insights to drive smarter decision-making.
Suppliers Bargaining Power
Limited Number of Specialized Suppliers
The fiber optic cable market is dominated by a few specialized suppliers. This concentration, including companies like Corning, gives them pricing power. In 2024, Corning reported over $14 billion in sales. This market dynamic affects FiberLight's costs and supply chain.
High Switching Costs for Fiber Optic Infrastructure
FiberLight faces high switching costs. Changing suppliers for fiber optic components is expensive. Compatibility issues and network integration challenges arise. This dependence on existing suppliers increases their bargaining power. In 2024, the average cost to replace fiber optic infrastructure was $15,000 per mile.
Proprietary Technology and Patents
FiberLight faces supplier power when unique tech or patents are held, like advanced fiber optic cables. In 2024, specialized components can have limited sources. This scarcity boosts supplier influence. For example, a key patent holder could command higher prices.
Increasing Demand for Fiber Optic Components
The surge in global demand for high-speed internet, 5G, and data center expansion boosts demand for fiber optic components. This increased demand can strengthen supplier power, potentially leading to higher prices. Suppliers might gain leverage in negotiations due to this demand. Fiber optic cable market was valued at $9.7 billion in 2024.
- Global fiber optic cable market size was estimated at USD 9.7 billion in 2024.
- The market is projected to reach USD 16.7 billion by 2029.
- This represents a CAGR of 11.50% between 2024 and 2029.
- Data center expansion is a major driver.
Vertical Integration of Suppliers
FiberLight faces supplier power, particularly from vertically integrated firms in the fiber optic market. These suppliers, involved in raw materials, cable production, and network solutions, wield significant influence. Their control over the supply chain can affect FiberLight's costs and service delivery capabilities. This poses a risk to FiberLight's profitability and operational efficiency.
- Vertically integrated suppliers control a significant portion of the fiber optic market.
- FiberLight's dependence on these suppliers could lead to increased costs.
- Supplier control affects FiberLight's pricing strategies.
FiberLight's Supplier Power: High Costs & Market Dynamics
FiberLight's supplier bargaining power is high due to market concentration and specialized components. Switching costs and tech dependencies amplify this power. The booming demand for fiber optic components further strengthens suppliers. The global market was $9.7B in 2024, growing at 11.50% CAGR.
| Aspect | Impact on FiberLight | 2024 Data Points |
|---|---|---|
| Market Concentration | Limited supplier options, higher prices | Corning sales: $14B |
| Switching Costs | High costs to change suppliers | $15,000/mile for infra replacement |
| Demand Growth | Increased supplier leverage | Global market: $9.7B |
Customers Bargaining Power
Diverse Customer Base
FiberLight's diverse customer base—spanning enterprises, carriers, governments, and service providers—lessens customer bargaining power. This broad reach prevents any single client group from dominating pricing or service terms. For instance, in 2024, FiberLight's revenue was split across various sectors, no single client accounted for over 15% of sales. This distribution protects against undue customer influence.
Importance of Reliable and Scalable Infrastructure
FiberLight's enterprise and carrier clients depend on its fiber optic networks for critical data transmission. This reliance makes them less price-sensitive. In 2024, the demand for high-bandwidth services increased by 15%. Quality and reliability are key, potentially reducing their bargaining power.
Availability of Alternative Providers in Some Regions
FiberLight faces customer bargaining power where alternatives exist. In regions served by competitors like Zayo or Crown Castle, customers can negotiate better terms. For example, Zayo reported $2.67B in revenue in 2023, indicating strong market presence. This competition limits FiberLight's pricing flexibility.
Customer Sophistication and Technical Expertise
FiberLight's target customers, including carriers and large enterprises, are sophisticated buyers. These customers possess considerable technical expertise and a deep understanding of network technologies. This allows them to assess various offerings effectively, strengthening their negotiating position. In 2024, the average contract size for enterprise fiber optic services was approximately $250,000.
- Sophisticated buyers drive competitive pricing.
- Technical expertise enables informed decisions.
- Negotiating power is enhanced by evaluation skills.
- Average enterprise contract size: $250,000 (2024).
Potential for Customers to Build Their Own Infrastructure
Some major customers, like large tech firms or telecom companies, could opt to construct their own fiber optic networks. This strategy, known as vertical integration, lets them bypass FiberLight's services. This option becomes more appealing when dealing with specialized needs or high-volume data transfers. Building their own infrastructure can thus limit FiberLight's ability to set prices. For example, in 2024, vertical integration accounted for approximately 10-15% of network infrastructure decisions among Fortune 500 companies.
- Cost Savings: Building in-house might offer long-term cost benefits for high-bandwidth users.
- Control: Direct ownership provides greater control over network design and operations.
- Specificity: Customized networks can be tailored to unique business requirements.
- Market Data: In 2024, the average cost to deploy a new fiber mile was $40,000-$60,000.
Customer Bargaining Power: A Balanced View
FiberLight's customer bargaining power is moderate due to a diverse client base. Large enterprise and carrier clients' dependence on its services reduces their price sensitivity. However, competition and sophisticated buyers can enhance negotiation abilities.
| Factor | Impact | Data (2024) |
|---|---|---|
| Customer Diversity | Reduces bargaining power | No single client > 15% of sales |
| Service Dependence | Less price sensitivity | High-bandwidth demand up 15% |
| Competition | Increases bargaining power | Zayo's $2.67B revenue (2023) |
| Buyer Sophistication | Enhances negotiation | Avg. contract size $250,000 |
Rivalry Among Competitors
Presence of Multiple Fiber Optic Network Providers
The fiber optic network market features intense rivalry due to numerous providers, including national and regional players. This scenario escalates competition, especially for services like dark fiber and lit services. In 2024, major players like Lumen and Verizon invested billions to expand their fiber networks. This competition drives down prices and increases service options for businesses.
Competition on Price and Service Offerings
FiberLight faces intense competition from providers like Lumen and Zayo, who offer similar services. They compete on price, network reach, and bandwidth. In 2024, the fiber-optic services market saw significant price wars as providers vied for market share. This dynamic necessitates continuous service improvements.
Market Consolidation and Expansion
The telecom sector, including fiber optic network providers, is seeing consolidation via mergers and acquisitions. This leads to larger, more powerful competitors. For example, in 2024, there were several significant M&A deals. This increases competitive pressure. This includes expanded network footprints and resources.
Technological Advancements and Innovation
Technological advancements in fiber optic technology, like increased bandwidth and deployment methods, necessitate ongoing investment and innovation. Companies must continually adapt to stay competitive, fueling rivalry. The fiber optic cable market was valued at USD 9.8 billion in 2023. The adoption of 5G is driving demand for faster data transmission. This environment fosters intense competition among providers.
- Market size of fiber optic cable in 2023 was USD 9.8 billion.
- 5G adoption fuels demand for faster data transmission.
- Continuous investment and innovation are essential.
- Competition is high among fiber optic providers.
Regional Market Dynamics
Competitive rivalry for FiberLight hinges on regional market dynamics. Areas with dense fiber networks see fiercer competition, potentially squeezing margins. Conversely, underserved regions offer less rivalry, potentially leading to higher pricing power. FiberLight's market share in the Southeast, for example, is around 10%, indicating substantial competition. The varying competitive landscape requires tailored strategies for each region.
- Market share variations impact competitive intensity.
- Underserved areas offer growth opportunities.
- Pricing and service differentiation are key strategies.
- Regional market analysis is crucial for strategy.
Fiber Optic Market Heats Up: Competition Intensifies!
FiberLight faces intense competition in the fiber optic market, especially from major players like Lumen and Zayo. This rivalry is driven by factors such as price wars and the need for continuous service improvements. Consolidation through mergers and acquisitions further intensifies competition by creating larger rivals. Technological advancements and regional market dynamics also play a crucial role in shaping the competitive landscape.
| Metric | Value (2024) | Impact |
|---|---|---|
| Fiber Optic Market Growth | ~8% | Increased competition for market share |
| Average Price Decline | 5-7% | Pressure on profit margins |
| M&A Activity | Significant | Increased market concentration |
Product Information
Product Information
Shipping & Returns
Shipping & Returns
Description
What is included in the product
Analyzes FiberLight's position, identifying threats, market dynamics, and control by suppliers and buyers.
Spot competitive threats with clear force ratings and understand the impact on your business.
Full Version Awaits
FiberLight Porter's Five Forces Analysis
This preview showcases the full FiberLight Porter's Five Forces analysis. It provides an in-depth evaluation of industry competition, potential threats, and opportunities. The document details the company's competitive landscape, market dynamics, and strategic positioning. You're viewing the exact document you'll receive—fully formatted and ready to use.
Porter's Five Forces Analysis Template
Elevate Your Analysis with the Complete Porter's Five Forces Analysis
FiberLight faces moderate rivalry within the fiber-optic infrastructure market, with established players and aggressive pricing strategies. Buyer power is also moderate, as enterprise clients have some negotiating leverage. The threat of new entrants is low due to high capital requirements and regulatory hurdles. Supplier power from equipment manufacturers is moderate. The threat of substitutes, such as wireless solutions, presents a growing, though still limited, challenge.
The complete report reveals the real forces shaping FiberLight’s industry—from supplier influence to threat of new entrants. Gain actionable insights to drive smarter decision-making.
Suppliers Bargaining Power
Limited Number of Specialized Suppliers
The fiber optic cable market is dominated by a few specialized suppliers. This concentration, including companies like Corning, gives them pricing power. In 2024, Corning reported over $14 billion in sales. This market dynamic affects FiberLight's costs and supply chain.
High Switching Costs for Fiber Optic Infrastructure
FiberLight faces high switching costs. Changing suppliers for fiber optic components is expensive. Compatibility issues and network integration challenges arise. This dependence on existing suppliers increases their bargaining power. In 2024, the average cost to replace fiber optic infrastructure was $15,000 per mile.
Proprietary Technology and Patents
FiberLight faces supplier power when unique tech or patents are held, like advanced fiber optic cables. In 2024, specialized components can have limited sources. This scarcity boosts supplier influence. For example, a key patent holder could command higher prices.
Increasing Demand for Fiber Optic Components
The surge in global demand for high-speed internet, 5G, and data center expansion boosts demand for fiber optic components. This increased demand can strengthen supplier power, potentially leading to higher prices. Suppliers might gain leverage in negotiations due to this demand. Fiber optic cable market was valued at $9.7 billion in 2024.
- Global fiber optic cable market size was estimated at USD 9.7 billion in 2024.
- The market is projected to reach USD 16.7 billion by 2029.
- This represents a CAGR of 11.50% between 2024 and 2029.
- Data center expansion is a major driver.
Vertical Integration of Suppliers
FiberLight faces supplier power, particularly from vertically integrated firms in the fiber optic market. These suppliers, involved in raw materials, cable production, and network solutions, wield significant influence. Their control over the supply chain can affect FiberLight's costs and service delivery capabilities. This poses a risk to FiberLight's profitability and operational efficiency.
- Vertically integrated suppliers control a significant portion of the fiber optic market.
- FiberLight's dependence on these suppliers could lead to increased costs.
- Supplier control affects FiberLight's pricing strategies.
FiberLight's Supplier Power: High Costs & Market Dynamics
FiberLight's supplier bargaining power is high due to market concentration and specialized components. Switching costs and tech dependencies amplify this power. The booming demand for fiber optic components further strengthens suppliers. The global market was $9.7B in 2024, growing at 11.50% CAGR.
| Aspect | Impact on FiberLight | 2024 Data Points |
|---|---|---|
| Market Concentration | Limited supplier options, higher prices | Corning sales: $14B |
| Switching Costs | High costs to change suppliers | $15,000/mile for infra replacement |
| Demand Growth | Increased supplier leverage | Global market: $9.7B |
Customers Bargaining Power
Diverse Customer Base
FiberLight's diverse customer base—spanning enterprises, carriers, governments, and service providers—lessens customer bargaining power. This broad reach prevents any single client group from dominating pricing or service terms. For instance, in 2024, FiberLight's revenue was split across various sectors, no single client accounted for over 15% of sales. This distribution protects against undue customer influence.
Importance of Reliable and Scalable Infrastructure
FiberLight's enterprise and carrier clients depend on its fiber optic networks for critical data transmission. This reliance makes them less price-sensitive. In 2024, the demand for high-bandwidth services increased by 15%. Quality and reliability are key, potentially reducing their bargaining power.
Availability of Alternative Providers in Some Regions
FiberLight faces customer bargaining power where alternatives exist. In regions served by competitors like Zayo or Crown Castle, customers can negotiate better terms. For example, Zayo reported $2.67B in revenue in 2023, indicating strong market presence. This competition limits FiberLight's pricing flexibility.
Customer Sophistication and Technical Expertise
FiberLight's target customers, including carriers and large enterprises, are sophisticated buyers. These customers possess considerable technical expertise and a deep understanding of network technologies. This allows them to assess various offerings effectively, strengthening their negotiating position. In 2024, the average contract size for enterprise fiber optic services was approximately $250,000.
- Sophisticated buyers drive competitive pricing.
- Technical expertise enables informed decisions.
- Negotiating power is enhanced by evaluation skills.
- Average enterprise contract size: $250,000 (2024).
Potential for Customers to Build Their Own Infrastructure
Some major customers, like large tech firms or telecom companies, could opt to construct their own fiber optic networks. This strategy, known as vertical integration, lets them bypass FiberLight's services. This option becomes more appealing when dealing with specialized needs or high-volume data transfers. Building their own infrastructure can thus limit FiberLight's ability to set prices. For example, in 2024, vertical integration accounted for approximately 10-15% of network infrastructure decisions among Fortune 500 companies.
- Cost Savings: Building in-house might offer long-term cost benefits for high-bandwidth users.
- Control: Direct ownership provides greater control over network design and operations.
- Specificity: Customized networks can be tailored to unique business requirements.
- Market Data: In 2024, the average cost to deploy a new fiber mile was $40,000-$60,000.
Customer Bargaining Power: A Balanced View
FiberLight's customer bargaining power is moderate due to a diverse client base. Large enterprise and carrier clients' dependence on its services reduces their price sensitivity. However, competition and sophisticated buyers can enhance negotiation abilities.
| Factor | Impact | Data (2024) |
|---|---|---|
| Customer Diversity | Reduces bargaining power | No single client > 15% of sales |
| Service Dependence | Less price sensitivity | High-bandwidth demand up 15% |
| Competition | Increases bargaining power | Zayo's $2.67B revenue (2023) |
| Buyer Sophistication | Enhances negotiation | Avg. contract size $250,000 |
Rivalry Among Competitors
Presence of Multiple Fiber Optic Network Providers
The fiber optic network market features intense rivalry due to numerous providers, including national and regional players. This scenario escalates competition, especially for services like dark fiber and lit services. In 2024, major players like Lumen and Verizon invested billions to expand their fiber networks. This competition drives down prices and increases service options for businesses.
Competition on Price and Service Offerings
FiberLight faces intense competition from providers like Lumen and Zayo, who offer similar services. They compete on price, network reach, and bandwidth. In 2024, the fiber-optic services market saw significant price wars as providers vied for market share. This dynamic necessitates continuous service improvements.
Market Consolidation and Expansion
The telecom sector, including fiber optic network providers, is seeing consolidation via mergers and acquisitions. This leads to larger, more powerful competitors. For example, in 2024, there were several significant M&A deals. This increases competitive pressure. This includes expanded network footprints and resources.
Technological Advancements and Innovation
Technological advancements in fiber optic technology, like increased bandwidth and deployment methods, necessitate ongoing investment and innovation. Companies must continually adapt to stay competitive, fueling rivalry. The fiber optic cable market was valued at USD 9.8 billion in 2023. The adoption of 5G is driving demand for faster data transmission. This environment fosters intense competition among providers.
- Market size of fiber optic cable in 2023 was USD 9.8 billion.
- 5G adoption fuels demand for faster data transmission.
- Continuous investment and innovation are essential.
- Competition is high among fiber optic providers.
Regional Market Dynamics
Competitive rivalry for FiberLight hinges on regional market dynamics. Areas with dense fiber networks see fiercer competition, potentially squeezing margins. Conversely, underserved regions offer less rivalry, potentially leading to higher pricing power. FiberLight's market share in the Southeast, for example, is around 10%, indicating substantial competition. The varying competitive landscape requires tailored strategies for each region.
- Market share variations impact competitive intensity.
- Underserved areas offer growth opportunities.
- Pricing and service differentiation are key strategies.
- Regional market analysis is crucial for strategy.
Fiber Optic Market Heats Up: Competition Intensifies!
FiberLight faces intense competition in the fiber optic market, especially from major players like Lumen and Zayo. This rivalry is driven by factors such as price wars and the need for continuous service improvements. Consolidation through mergers and acquisitions further intensifies competition by creating larger rivals. Technological advancements and regional market dynamics also play a crucial role in shaping the competitive landscape.
| Metric | Value (2024) | Impact |
|---|---|---|
| Fiber Optic Market Growth | ~8% | Increased competition for market share |
| Average Price Decline | 5-7% | Pressure on profit margins |
| M&A Activity | Significant | Increased market concentration |


