LATCH PORTER'S FIVE FORCES TEMPLATE RESEARCH
What is included in the product
Evaluates control held by suppliers and buyers, and their influence on pricing and profitability.
A tailored dashboard to identify vulnerabilities, strengthening strategic planning.
Same Document Delivered
Latch Porter's Five Forces Analysis
This is the complete Latch Porter's Five Forces analysis. The preview you are seeing is identical to the comprehensive document you will receive immediately upon purchase, ready for your review.

Porter's Five Forces Analysis Template
A Must-Have Tool for Decision-Makers
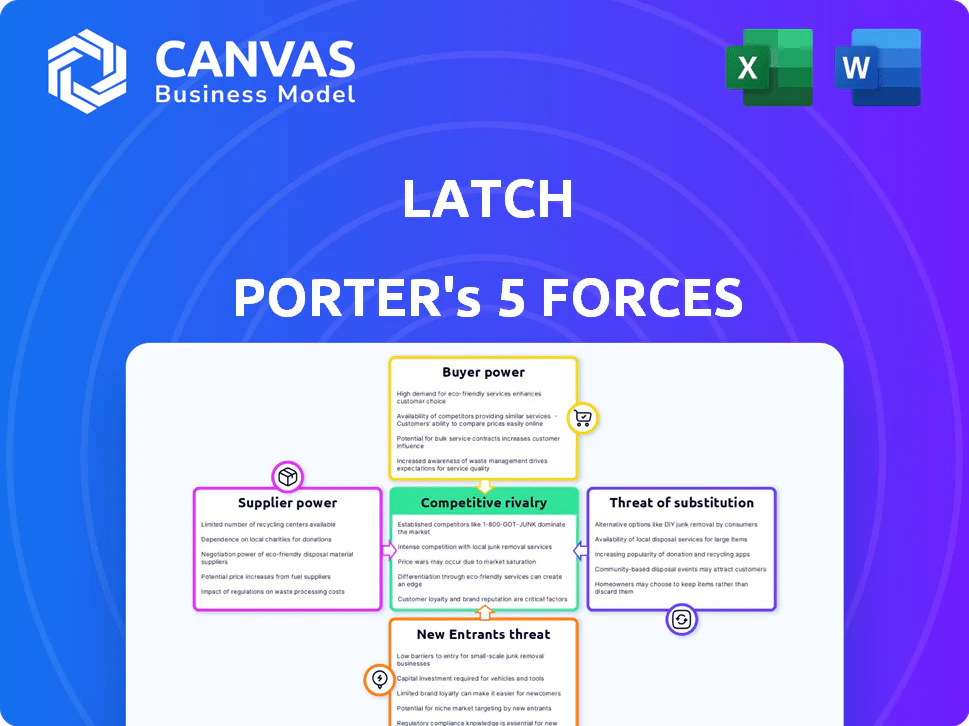
Latch's competitive landscape is shaped by five key forces. Buyer power is a crucial factor, considering customer concentration and switching costs. The threat of new entrants depends on high initial investment and market regulations. The intensity of rivalry is heightened by the industry's growth rate and product differentiation. Substitute products, particularly smart home alternatives, pose a moderate threat. Finally, supplier power is relatively low due to diverse component sources.
This brief snapshot only scratches the surface. Unlock the full Porter's Five Forces Analysis to explore Latch’s competitive dynamics, market pressures, and strategic advantages in detail.
Suppliers Bargaining Power
Component and Hardware Suppliers
Latch depends on suppliers for hardware components like locks and sensors. The bargaining power of these suppliers is affected by factors like component uniqueness, supplier availability, and switching costs. If specialized components have few suppliers, their power rises. In 2024, supply chain issues impacted tech firms, potentially increasing supplier influence. For example, in Q3 2024, Intel reported that its gross margin was impacted by component costs.
Software and Technology Providers
Latch's system relies on software and technologies like cloud computing and IoT. The power of these providers hinges on technology prevalence and standardization. If Latch uses unique software, suppliers gain more leverage. In 2024, cloud computing spending reached $670 billion, highlighting supplier influence.

Connectivity and Network Providers
Latch's products depend on Wi-Fi and future 5G for functionality. Network service providers wield bargaining power, influencing service availability and cost based on building locations. 5G's rollout is changing building connectivity, impacting Latch's operational costs. In 2024, 5G covered 90% of the U.S. population, with costs varying regionally. This affects Latch's network expenses.
Installation and Maintenance Service Providers
Latch relies on third-party providers for installation and maintenance, which affects its supplier power. The concentration of skilled installers and maintenance personnel in specific geographic areas can create leverage for these providers. A scarcity of qualified technicians could drive up service costs for Latch. In 2024, the average hourly rate for skilled tradespeople, including installers, has increased by approximately 3-5% due to demand.
- Geographic limitations and concentration of skilled labor play a crucial role.
- Scarcity of qualified technicians increases service costs.
- Average hourly rates for skilled tradespeople increased by 3-5% in 2024.
- Third-party providers' bargaining power directly impacts Latch.
Reliance on Key Technologies
Latch's products heavily rely on key technologies like IoT and AI, increasing its vulnerability to suppliers. Companies owning these technologies, such as those providing AI or cloud services, may wield significant power. This influence can be exerted through licensing, updates, or control over technological advancements. The bargaining power of suppliers is amplified by Latch's dependence on these critical components.
- IoT market projected to reach $2.4T by 2029, illustrating supplier influence.
- AI software revenue reached $150B in 2023, emphasizing key technology provider strength.
- Cloud computing market valued at $545.8B in 2023, showing significant supplier control.
Supplier Dynamics: Power & Influence
Latch's suppliers' power stems from component uniqueness and market concentration. Scarcity of skilled installers, with hourly rates up 3-5% in 2024, boosts their leverage. IoT's projected $2.4T market by 2029 and $150B AI software revenue in 2023 highlight supplier influence.
| Factor | Impact on Latch | 2024 Data |
|---|---|---|
| Component Uniqueness | Higher supplier power | Intel's margin impacted by costs in Q3 |
| Cloud & Software | Supplier control | $670B cloud spending |
| Installer Scarcity | Increased service costs | Hourly rates up 3-5% |
Customers Bargaining Power
Large Property Management Companies and Developers
Latch's main clients are big property management firms and developers overseeing many apartments. These big clients wield considerable buying power due to the sheer volume of units they control. They can push for better prices, tailored solutions, and advantageous contract conditions. In 2024, the multifamily market saw a slight dip in new construction starts, which could intensify price negotiations. The average discount rate on bulk purchases of smart home tech like Latch's could range from 5% to 15%, depending on the deal size and the customer's bargaining strength.
Concentration of Customers
If Latch relies heavily on a few key customers, those customers gain substantial bargaining power. This concentration allows them to negotiate more favorable terms and pricing. For instance, if 60% of Latch's revenue comes from just three clients, those clients hold significant leverage. This reliance could pressure Latch to accept lower profit margins to retain those crucial contracts.

Switching Costs for Customers
Switching costs significantly impact customer bargaining power within Latch's market. Replacing Latch's system involves considerable expenses for new hardware, installation, and retraining. The costs to switch, which can range from $5,000 to $50,000 per building, depending on the size and complexity, reduce customers' ability to negotiate better terms or prices.
Availability of Alternatives
Customers can choose from many alternatives for building access, such as traditional locks, key cards, and other smart lock systems. These choices give them leverage. For example, in 2024, the global smart lock market was valued at $2.4 billion. This shows the wide range of options. This availability empowers customers to negotiate better terms.
- Market competition increases customer choice and leverage.
- Smart lock adoption is growing, with an estimated 15% market penetration in 2024.
- Alternative systems include traditional locks, key cards, and other smart access providers.
- Customers can switch to other options, increasing their bargaining power.
Customer Price Sensitivity
Property management is notably cost-sensitive. The pricing of Latch's system and its subscription fees significantly influence customer decisions. Due to this, customers possess strong bargaining power, often opting for more affordable alternatives. This price sensitivity is amplified by the availability of competing smart lock and access control systems. In 2024, the average cost for smart lock systems ranged from $150 to $400 per unit, while subscription fees varied widely depending on features and the number of units.
- Smart lock systems' average cost: $150 to $400 per unit.
- Subscription fees vary based on features.
- Customers can choose between different options.
- Property management is a cost-sensitive business.
Customer Power: A Threat to Smart Lock's Success
Latch faces strong customer bargaining power due to concentrated client bases and price sensitivity. Large property management firms can negotiate favorable terms, especially with market competition. The smart lock market's growth, valued at $2.4 billion in 2024, offers customers alternatives, boosting their leverage.
| Factor | Impact | Data |
|---|---|---|
| Client Concentration | High bargaining power | 60% revenue from 3 clients |
| Market Alternatives | Increased leverage | $2.4B smart lock market (2024) |
| Price Sensitivity | Influences decisions | Smart lock cost: $150-$400/unit |
Rivalry Among Competitors
Number and Diversity of Competitors
The smart building and access control sectors are intensely competitive, featuring numerous players. Innovation thrives, fueled by tech advancements and demand for sustainable buildings. Competitors span traditional lock makers to tech firms. In 2024, the global smart lock market was valued at $2.4 billion, showing robust growth.
Market Growth Rate
The smart building market's rapid expansion is a key factor in competitive rivalry. The global market was worth $108 billion in 2023, with a projected 28.5% CAGR from 2024 to 2030. This growth attracts new entrants, increasing competition. Existing firms must fight harder to maintain or grow their market share in this dynamic environment.

Product Differentiation
Latch differentiates with a full-building OS. This includes smart access, devices, and property software. Competitors may offer similar integrated solutions, increasing rivalry. In 2024, the smart home market grew, intensifying competition for Latch. Rivalry focuses on features, integration, and ecosystem strength.
Switching Costs for Customers
Switching costs for customers can be significant after a system is installed, fueling fierce competition to gain new clients. This dynamic intensifies rivalry, as keeping existing customers becomes crucial. Companies often resort to aggressive pricing strategies or offer comprehensive support to secure initial contracts. For instance, in the enterprise software sector, customer acquisition costs (CAC) can range from $5,000 to $50,000 depending on the complexity of the product and the sales cycle length, intensifying the battle for market share. This rivalry is especially pronounced in markets with high customer lifetime value (CLTV).
- High switching costs increase rivalry intensity.
- Companies invest heavily in initial customer acquisition.
- Aggressive pricing and support are common tactics.
- CAC can be substantial, especially in enterprise sectors.
Industry Concentration
Industry concentration in the smart building market varies; some areas are more competitive than others. Large companies like Allegion and Assa Abloy have significant market share in smart locks. This can spark intense rivalry, affecting pricing and innovation.
- Allegion's revenue in 2023 was $3.4 billion.
- Assa Abloy's sales in 2023 reached approximately $15.8 billion.
- The smart lock market is expected to reach $5.6 billion by 2029.
- Competition drives companies to offer more features and better prices.
Smart Buildings: A Competitive Landscape
Competitive rivalry in smart buildings is fierce. Multiple players compete, spurring innovation. High switching costs intensify battles for new clients. In 2024, the smart lock market hit $2.4B, showing growth.
| Factor | Impact | Example |
|---|---|---|
| Market Growth | Attracts new entrants | 28.5% CAGR (2024-2030) |
| Switching Costs | Intensifies competition | Enterprise CAC $5K-$50K |
| Industry Concentration | Affects rivalry intensity | Assa Abloy sales ~$15.8B (2023) |
LATCH PORTER'S FIVE FORCES TEMPLATE RESEARCH
What is included in the product
Evaluates control held by suppliers and buyers, and their influence on pricing and profitability.
A tailored dashboard to identify vulnerabilities, strengthening strategic planning.
Same Document Delivered
Latch Porter's Five Forces Analysis
This is the complete Latch Porter's Five Forces analysis. The preview you are seeing is identical to the comprehensive document you will receive immediately upon purchase, ready for your review.
Porter's Five Forces Analysis Template
A Must-Have Tool for Decision-Makers
Latch's competitive landscape is shaped by five key forces. Buyer power is a crucial factor, considering customer concentration and switching costs. The threat of new entrants depends on high initial investment and market regulations. The intensity of rivalry is heightened by the industry's growth rate and product differentiation. Substitute products, particularly smart home alternatives, pose a moderate threat. Finally, supplier power is relatively low due to diverse component sources.
This brief snapshot only scratches the surface. Unlock the full Porter's Five Forces Analysis to explore Latch’s competitive dynamics, market pressures, and strategic advantages in detail.
Suppliers Bargaining Power
Component and Hardware Suppliers
Latch depends on suppliers for hardware components like locks and sensors. The bargaining power of these suppliers is affected by factors like component uniqueness, supplier availability, and switching costs. If specialized components have few suppliers, their power rises. In 2024, supply chain issues impacted tech firms, potentially increasing supplier influence. For example, in Q3 2024, Intel reported that its gross margin was impacted by component costs.
Software and Technology Providers
Latch's system relies on software and technologies like cloud computing and IoT. The power of these providers hinges on technology prevalence and standardization. If Latch uses unique software, suppliers gain more leverage. In 2024, cloud computing spending reached $670 billion, highlighting supplier influence.
Connectivity and Network Providers
Latch's products depend on Wi-Fi and future 5G for functionality. Network service providers wield bargaining power, influencing service availability and cost based on building locations. 5G's rollout is changing building connectivity, impacting Latch's operational costs. In 2024, 5G covered 90% of the U.S. population, with costs varying regionally. This affects Latch's network expenses.
Installation and Maintenance Service Providers
Latch relies on third-party providers for installation and maintenance, which affects its supplier power. The concentration of skilled installers and maintenance personnel in specific geographic areas can create leverage for these providers. A scarcity of qualified technicians could drive up service costs for Latch. In 2024, the average hourly rate for skilled tradespeople, including installers, has increased by approximately 3-5% due to demand.
- Geographic limitations and concentration of skilled labor play a crucial role.
- Scarcity of qualified technicians increases service costs.
- Average hourly rates for skilled tradespeople increased by 3-5% in 2024.
- Third-party providers' bargaining power directly impacts Latch.
Reliance on Key Technologies
Latch's products heavily rely on key technologies like IoT and AI, increasing its vulnerability to suppliers. Companies owning these technologies, such as those providing AI or cloud services, may wield significant power. This influence can be exerted through licensing, updates, or control over technological advancements. The bargaining power of suppliers is amplified by Latch's dependence on these critical components.
- IoT market projected to reach $2.4T by 2029, illustrating supplier influence.
- AI software revenue reached $150B in 2023, emphasizing key technology provider strength.
- Cloud computing market valued at $545.8B in 2023, showing significant supplier control.
Supplier Dynamics: Power & Influence
Latch's suppliers' power stems from component uniqueness and market concentration. Scarcity of skilled installers, with hourly rates up 3-5% in 2024, boosts their leverage. IoT's projected $2.4T market by 2029 and $150B AI software revenue in 2023 highlight supplier influence.
| Factor | Impact on Latch | 2024 Data |
|---|---|---|
| Component Uniqueness | Higher supplier power | Intel's margin impacted by costs in Q3 |
| Cloud & Software | Supplier control | $670B cloud spending |
| Installer Scarcity | Increased service costs | Hourly rates up 3-5% |
Customers Bargaining Power
Large Property Management Companies and Developers
Latch's main clients are big property management firms and developers overseeing many apartments. These big clients wield considerable buying power due to the sheer volume of units they control. They can push for better prices, tailored solutions, and advantageous contract conditions. In 2024, the multifamily market saw a slight dip in new construction starts, which could intensify price negotiations. The average discount rate on bulk purchases of smart home tech like Latch's could range from 5% to 15%, depending on the deal size and the customer's bargaining strength.
Concentration of Customers
If Latch relies heavily on a few key customers, those customers gain substantial bargaining power. This concentration allows them to negotiate more favorable terms and pricing. For instance, if 60% of Latch's revenue comes from just three clients, those clients hold significant leverage. This reliance could pressure Latch to accept lower profit margins to retain those crucial contracts.
Switching Costs for Customers
Switching costs significantly impact customer bargaining power within Latch's market. Replacing Latch's system involves considerable expenses for new hardware, installation, and retraining. The costs to switch, which can range from $5,000 to $50,000 per building, depending on the size and complexity, reduce customers' ability to negotiate better terms or prices.
Availability of Alternatives
Customers can choose from many alternatives for building access, such as traditional locks, key cards, and other smart lock systems. These choices give them leverage. For example, in 2024, the global smart lock market was valued at $2.4 billion. This shows the wide range of options. This availability empowers customers to negotiate better terms.
- Market competition increases customer choice and leverage.
- Smart lock adoption is growing, with an estimated 15% market penetration in 2024.
- Alternative systems include traditional locks, key cards, and other smart access providers.
- Customers can switch to other options, increasing their bargaining power.
Customer Price Sensitivity
Property management is notably cost-sensitive. The pricing of Latch's system and its subscription fees significantly influence customer decisions. Due to this, customers possess strong bargaining power, often opting for more affordable alternatives. This price sensitivity is amplified by the availability of competing smart lock and access control systems. In 2024, the average cost for smart lock systems ranged from $150 to $400 per unit, while subscription fees varied widely depending on features and the number of units.
- Smart lock systems' average cost: $150 to $400 per unit.
- Subscription fees vary based on features.
- Customers can choose between different options.
- Property management is a cost-sensitive business.
Customer Power: A Threat to Smart Lock's Success
Latch faces strong customer bargaining power due to concentrated client bases and price sensitivity. Large property management firms can negotiate favorable terms, especially with market competition. The smart lock market's growth, valued at $2.4 billion in 2024, offers customers alternatives, boosting their leverage.
| Factor | Impact | Data |
|---|---|---|
| Client Concentration | High bargaining power | 60% revenue from 3 clients |
| Market Alternatives | Increased leverage | $2.4B smart lock market (2024) |
| Price Sensitivity | Influences decisions | Smart lock cost: $150-$400/unit |
Rivalry Among Competitors
Number and Diversity of Competitors
The smart building and access control sectors are intensely competitive, featuring numerous players. Innovation thrives, fueled by tech advancements and demand for sustainable buildings. Competitors span traditional lock makers to tech firms. In 2024, the global smart lock market was valued at $2.4 billion, showing robust growth.
Market Growth Rate
The smart building market's rapid expansion is a key factor in competitive rivalry. The global market was worth $108 billion in 2023, with a projected 28.5% CAGR from 2024 to 2030. This growth attracts new entrants, increasing competition. Existing firms must fight harder to maintain or grow their market share in this dynamic environment.
Product Differentiation
Latch differentiates with a full-building OS. This includes smart access, devices, and property software. Competitors may offer similar integrated solutions, increasing rivalry. In 2024, the smart home market grew, intensifying competition for Latch. Rivalry focuses on features, integration, and ecosystem strength.
Switching Costs for Customers
Switching costs for customers can be significant after a system is installed, fueling fierce competition to gain new clients. This dynamic intensifies rivalry, as keeping existing customers becomes crucial. Companies often resort to aggressive pricing strategies or offer comprehensive support to secure initial contracts. For instance, in the enterprise software sector, customer acquisition costs (CAC) can range from $5,000 to $50,000 depending on the complexity of the product and the sales cycle length, intensifying the battle for market share. This rivalry is especially pronounced in markets with high customer lifetime value (CLTV).
- High switching costs increase rivalry intensity.
- Companies invest heavily in initial customer acquisition.
- Aggressive pricing and support are common tactics.
- CAC can be substantial, especially in enterprise sectors.
Industry Concentration
Industry concentration in the smart building market varies; some areas are more competitive than others. Large companies like Allegion and Assa Abloy have significant market share in smart locks. This can spark intense rivalry, affecting pricing and innovation.
- Allegion's revenue in 2023 was $3.4 billion.
- Assa Abloy's sales in 2023 reached approximately $15.8 billion.
- The smart lock market is expected to reach $5.6 billion by 2029.
- Competition drives companies to offer more features and better prices.
Smart Buildings: A Competitive Landscape
Competitive rivalry in smart buildings is fierce. Multiple players compete, spurring innovation. High switching costs intensify battles for new clients. In 2024, the smart lock market hit $2.4B, showing growth.
| Factor | Impact | Example |
|---|---|---|
| Market Growth | Attracts new entrants | 28.5% CAGR (2024-2030) |
| Switching Costs | Intensifies competition | Enterprise CAC $5K-$50K |
| Industry Concentration | Affects rivalry intensity | Assa Abloy sales ~$15.8B (2023) |
Product Information
Product Information
Shipping & Returns
Shipping & Returns
Description
What is included in the product
Evaluates control held by suppliers and buyers, and their influence on pricing and profitability.
A tailored dashboard to identify vulnerabilities, strengthening strategic planning.
Same Document Delivered
Latch Porter's Five Forces Analysis
This is the complete Latch Porter's Five Forces analysis. The preview you are seeing is identical to the comprehensive document you will receive immediately upon purchase, ready for your review.
Porter's Five Forces Analysis Template
A Must-Have Tool for Decision-Makers
Latch's competitive landscape is shaped by five key forces. Buyer power is a crucial factor, considering customer concentration and switching costs. The threat of new entrants depends on high initial investment and market regulations. The intensity of rivalry is heightened by the industry's growth rate and product differentiation. Substitute products, particularly smart home alternatives, pose a moderate threat. Finally, supplier power is relatively low due to diverse component sources.
This brief snapshot only scratches the surface. Unlock the full Porter's Five Forces Analysis to explore Latch’s competitive dynamics, market pressures, and strategic advantages in detail.
Suppliers Bargaining Power
Component and Hardware Suppliers
Latch depends on suppliers for hardware components like locks and sensors. The bargaining power of these suppliers is affected by factors like component uniqueness, supplier availability, and switching costs. If specialized components have few suppliers, their power rises. In 2024, supply chain issues impacted tech firms, potentially increasing supplier influence. For example, in Q3 2024, Intel reported that its gross margin was impacted by component costs.
Software and Technology Providers
Latch's system relies on software and technologies like cloud computing and IoT. The power of these providers hinges on technology prevalence and standardization. If Latch uses unique software, suppliers gain more leverage. In 2024, cloud computing spending reached $670 billion, highlighting supplier influence.
Connectivity and Network Providers
Latch's products depend on Wi-Fi and future 5G for functionality. Network service providers wield bargaining power, influencing service availability and cost based on building locations. 5G's rollout is changing building connectivity, impacting Latch's operational costs. In 2024, 5G covered 90% of the U.S. population, with costs varying regionally. This affects Latch's network expenses.
Installation and Maintenance Service Providers
Latch relies on third-party providers for installation and maintenance, which affects its supplier power. The concentration of skilled installers and maintenance personnel in specific geographic areas can create leverage for these providers. A scarcity of qualified technicians could drive up service costs for Latch. In 2024, the average hourly rate for skilled tradespeople, including installers, has increased by approximately 3-5% due to demand.
- Geographic limitations and concentration of skilled labor play a crucial role.
- Scarcity of qualified technicians increases service costs.
- Average hourly rates for skilled tradespeople increased by 3-5% in 2024.
- Third-party providers' bargaining power directly impacts Latch.
Reliance on Key Technologies
Latch's products heavily rely on key technologies like IoT and AI, increasing its vulnerability to suppliers. Companies owning these technologies, such as those providing AI or cloud services, may wield significant power. This influence can be exerted through licensing, updates, or control over technological advancements. The bargaining power of suppliers is amplified by Latch's dependence on these critical components.
- IoT market projected to reach $2.4T by 2029, illustrating supplier influence.
- AI software revenue reached $150B in 2023, emphasizing key technology provider strength.
- Cloud computing market valued at $545.8B in 2023, showing significant supplier control.
Supplier Dynamics: Power & Influence
Latch's suppliers' power stems from component uniqueness and market concentration. Scarcity of skilled installers, with hourly rates up 3-5% in 2024, boosts their leverage. IoT's projected $2.4T market by 2029 and $150B AI software revenue in 2023 highlight supplier influence.
| Factor | Impact on Latch | 2024 Data |
|---|---|---|
| Component Uniqueness | Higher supplier power | Intel's margin impacted by costs in Q3 |
| Cloud & Software | Supplier control | $670B cloud spending |
| Installer Scarcity | Increased service costs | Hourly rates up 3-5% |
Customers Bargaining Power
Large Property Management Companies and Developers
Latch's main clients are big property management firms and developers overseeing many apartments. These big clients wield considerable buying power due to the sheer volume of units they control. They can push for better prices, tailored solutions, and advantageous contract conditions. In 2024, the multifamily market saw a slight dip in new construction starts, which could intensify price negotiations. The average discount rate on bulk purchases of smart home tech like Latch's could range from 5% to 15%, depending on the deal size and the customer's bargaining strength.
Concentration of Customers
If Latch relies heavily on a few key customers, those customers gain substantial bargaining power. This concentration allows them to negotiate more favorable terms and pricing. For instance, if 60% of Latch's revenue comes from just three clients, those clients hold significant leverage. This reliance could pressure Latch to accept lower profit margins to retain those crucial contracts.
Switching Costs for Customers
Switching costs significantly impact customer bargaining power within Latch's market. Replacing Latch's system involves considerable expenses for new hardware, installation, and retraining. The costs to switch, which can range from $5,000 to $50,000 per building, depending on the size and complexity, reduce customers' ability to negotiate better terms or prices.
Availability of Alternatives
Customers can choose from many alternatives for building access, such as traditional locks, key cards, and other smart lock systems. These choices give them leverage. For example, in 2024, the global smart lock market was valued at $2.4 billion. This shows the wide range of options. This availability empowers customers to negotiate better terms.
- Market competition increases customer choice and leverage.
- Smart lock adoption is growing, with an estimated 15% market penetration in 2024.
- Alternative systems include traditional locks, key cards, and other smart access providers.
- Customers can switch to other options, increasing their bargaining power.
Customer Price Sensitivity
Property management is notably cost-sensitive. The pricing of Latch's system and its subscription fees significantly influence customer decisions. Due to this, customers possess strong bargaining power, often opting for more affordable alternatives. This price sensitivity is amplified by the availability of competing smart lock and access control systems. In 2024, the average cost for smart lock systems ranged from $150 to $400 per unit, while subscription fees varied widely depending on features and the number of units.
- Smart lock systems' average cost: $150 to $400 per unit.
- Subscription fees vary based on features.
- Customers can choose between different options.
- Property management is a cost-sensitive business.
Customer Power: A Threat to Smart Lock's Success
Latch faces strong customer bargaining power due to concentrated client bases and price sensitivity. Large property management firms can negotiate favorable terms, especially with market competition. The smart lock market's growth, valued at $2.4 billion in 2024, offers customers alternatives, boosting their leverage.
| Factor | Impact | Data |
|---|---|---|
| Client Concentration | High bargaining power | 60% revenue from 3 clients |
| Market Alternatives | Increased leverage | $2.4B smart lock market (2024) |
| Price Sensitivity | Influences decisions | Smart lock cost: $150-$400/unit |
Rivalry Among Competitors
Number and Diversity of Competitors
The smart building and access control sectors are intensely competitive, featuring numerous players. Innovation thrives, fueled by tech advancements and demand for sustainable buildings. Competitors span traditional lock makers to tech firms. In 2024, the global smart lock market was valued at $2.4 billion, showing robust growth.
Market Growth Rate
The smart building market's rapid expansion is a key factor in competitive rivalry. The global market was worth $108 billion in 2023, with a projected 28.5% CAGR from 2024 to 2030. This growth attracts new entrants, increasing competition. Existing firms must fight harder to maintain or grow their market share in this dynamic environment.
Product Differentiation
Latch differentiates with a full-building OS. This includes smart access, devices, and property software. Competitors may offer similar integrated solutions, increasing rivalry. In 2024, the smart home market grew, intensifying competition for Latch. Rivalry focuses on features, integration, and ecosystem strength.
Switching Costs for Customers
Switching costs for customers can be significant after a system is installed, fueling fierce competition to gain new clients. This dynamic intensifies rivalry, as keeping existing customers becomes crucial. Companies often resort to aggressive pricing strategies or offer comprehensive support to secure initial contracts. For instance, in the enterprise software sector, customer acquisition costs (CAC) can range from $5,000 to $50,000 depending on the complexity of the product and the sales cycle length, intensifying the battle for market share. This rivalry is especially pronounced in markets with high customer lifetime value (CLTV).
- High switching costs increase rivalry intensity.
- Companies invest heavily in initial customer acquisition.
- Aggressive pricing and support are common tactics.
- CAC can be substantial, especially in enterprise sectors.
Industry Concentration
Industry concentration in the smart building market varies; some areas are more competitive than others. Large companies like Allegion and Assa Abloy have significant market share in smart locks. This can spark intense rivalry, affecting pricing and innovation.
- Allegion's revenue in 2023 was $3.4 billion.
- Assa Abloy's sales in 2023 reached approximately $15.8 billion.
- The smart lock market is expected to reach $5.6 billion by 2029.
- Competition drives companies to offer more features and better prices.
Smart Buildings: A Competitive Landscape
Competitive rivalry in smart buildings is fierce. Multiple players compete, spurring innovation. High switching costs intensify battles for new clients. In 2024, the smart lock market hit $2.4B, showing growth.
| Factor | Impact | Example |
|---|---|---|
| Market Growth | Attracts new entrants | 28.5% CAGR (2024-2030) |
| Switching Costs | Intensifies competition | Enterprise CAC $5K-$50K |
| Industry Concentration | Affects rivalry intensity | Assa Abloy sales ~$15.8B (2023) |


