LYFT PORTER'S FIVE FORCES TEMPLATE RESEARCH
Elevate Your Analysis with the Complete Porter's Five Forces Analysis
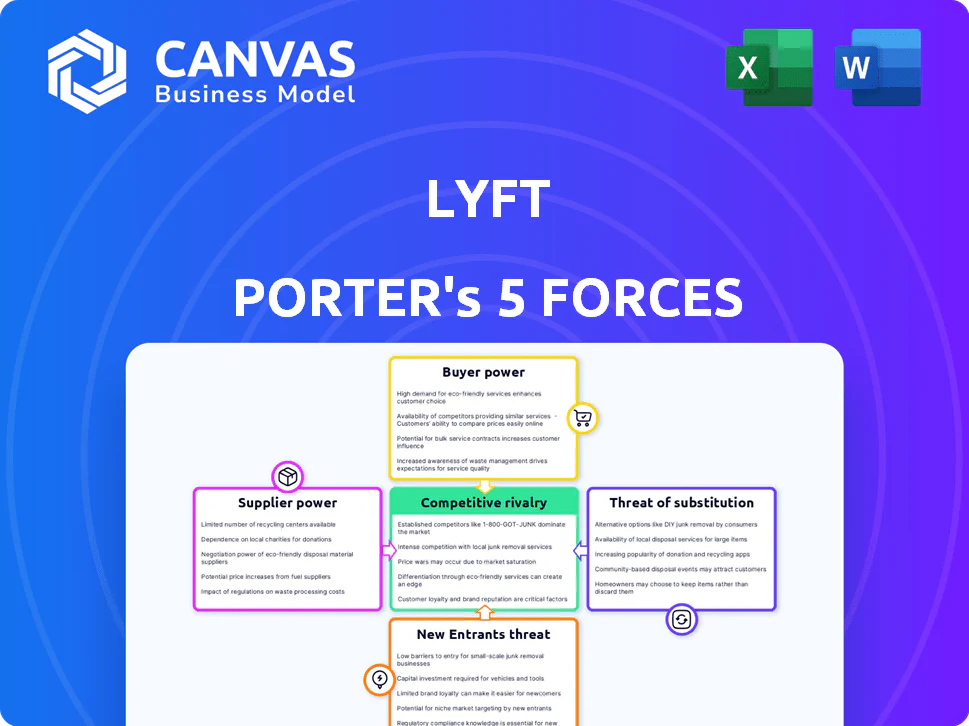
Lyft faces intense rivalry from market leader Uber, rising substitute pressures (micromobility, public transit), and moderate supplier power from drivers-while regulatory and capital barriers limit new entrants; this snapshot teases critical dynamics shaping Lyft's strategy and margins. Unlock the full Porter's Five Forces Analysis for force-by-force ratings, visuals, and actionable insights.
Suppliers Bargaining Power
Driver Labor Market Dynamics
In 2026 the driver supply is Lyft's most volatile input; U.S. active driver counts fell 6% YoY to ~520k in FY2025, increasing hourly churn and idle time.
Drivers are independent but multi-home: 62% report using 2+ platforms, so switching costs are low and bargaining power high.
Lyft must match rivals: average driver earnings target rose to $28.50/hr in 2025, forcing higher incentives and clearer pay transparency to avoid shortages.
Autonomous Technology Providers
As Lyft transitions to autonomous rides, Lyft's reliance on a few specialized suppliers-sensor and AV software firms plus automakers-intensifies; in 2025 Lyft reported $0 of vehicle manufacturing, so supplier bargaining power rises as key partners control integration and unit economics.

Cloud Computing and Mapping Infrastructure
Lyft's matching engine leans on Amazon Web Services and Google Maps Platform; in FY2025 Lyft reported cloud and mapping spend of about $520 million, making supplier leverage high.
Switching costs are steep-re-architecting services and map licensing could exceed hundreds of millions and months of downtime-so Lyft has limited negotiation power.
Any API or infrastructure price increases flow directly into Lyft's operating expenses; a 10% rise in these services would add roughly $52 million to FY2025 costs.
Commercial Insurance Costs
Insurance providers have gained bargaining power as ride-share risk profiles solidified; US regulations demand high liability coverage and fewer insurers underwrite urban auto fleets, pushing Lyft's commercial premiums up-Lyft reported insurance expense of $1.12 billion in 2025, a 14% YoY rise.
Concentrated underwriting markets limit rate-shopping without breaking compliance, so Lyft faces less price flexibility and higher fixed operating costs.
- 2025 insurance expense: $1.12 billion
- YoY increase: 14%
- Fewer major underwriters for urban risk
- Regulatory minimums raise mandatory coverage
Fuel and Vehicle Maintenance Partners
Fuel and maintenance partners wield meaningful power over Lyft because drivers absorb fuel, EV charging, and repair costs; in 2025 average US gasoline at about $3.70/gal and EV charging ~18¢/kWh materially affect driver margins.
Lyft's discount programs with Shell, BP, and repair chains (saving roughly 5-12%) aim to blunt churn by improving driver take-home pay tied to per-trip economics.
If partner pricing rises, driver net earnings fall and attrition to other gigs or jobs rises, reducing Lyft's supply and increasing costs per ride.
- Drivers pay fuel/charging/repairs → net earnings
- Avg gas $3.70/gal (2025) and charging ~18¢/kWh
- Partner discounts ~5-12% lower operating cost
- Price increases → higher driver churn → supply squeeze
Rising driver costs, insurance & cloud spend squeeze margins as suppliers gain leverage
Suppliers exert high bargaining power: FY2025 drivers ~520k (-6% YoY), 62% multi-home, avg target earnings $28.50/hr; cloud/maps spend ~$520M; insurance expense $1.12B (+14%); fuel $3.70/gal, EV charging ~$0.18/kWh-price moves directly raise costs and driver churn.
| Metric | FY2025 |
|---|---|
| Active drivers | ~520,000 |
| Multi-home rate | 62% |
| Driver target/hr | $28.50 |
| Cloud/maps spend | $520M |
| Insurance expense | $1.12B |
| Avg gas/charging | $3.70/gal; $0.18/kWh |
What is included in the product
Concise Porter's Five Forces for Lyft: evaluates rivalry, buyer/supplier power, entry barriers, and substitutes, highlighting ride-hailing competitive intensity, pricing pressures, regulatory risks, and strategic levers to protect market share.
Compact Porter's Five Forces snapshot for Lyft-pinpoints competitive threats and bargaining pressures so executives can prioritize actions and reduce strategic uncertainty.
Customers Bargaining Power
Low Switching Costs for Riders
Riders in 2026 commonly have Lyft and Uber both installed, letting them compare ETAs and fares in seconds; this reduces brand friction and makes loyalty secondary to price and convenience, pressuring Lyft to match Uber's median ride fare-about $14.50 in 2025-plus promotions.
Price Sensitivity in a Mature Market
With ride-sharing now a utility, riders show high price sensitivity-Uber and Lyft reported combined US rides growth slowed to 6% in 2025 while average trip fare pressures rose; 58% of surveyed riders say surge pricing makes them choose alternatives.
Lyft's elasticity forces frequent promotions: in 2025 Lyft spent $1.1B on marketing and incentives and pushed Lyft Pink subscriptions (priced $19/month) to stabilize trips and ARPU.

Demand for Safety and Service Quality
Riders now use app ratings and social media to demand safety and cleanliness; 72% of US rideshare users (2025 Pew/Kantar) say safety influences platform choice, driving churn risk if Lyft falls short.
High-profile incidents cut users: Lyft lost an estimated $210M in 2025 gross bookings after safety scandals, so reputational hits trigger rapid defections to competitors.
That social leverage forces Lyft to spend: 2025 filings show $185M on driver screening and $120M on in-app safety features, preserving public trust and regulatory standing.
Corporate and Enterprise Leverage
Lyft Business serves large corporations and healthcare providers that negotiate volume discounts-these clients accounted for an estimated 12% of Lyft's 2025 revenue, forcing lower margins in exchange for steady, high-volume rides.
To retain predictable cash flow, Lyft concedes on price and offers customized reporting and integration tools; enterprise deals often lock multi-year commitments with blended margins 5-8 percentage points below retail.
- Lyft Business ≈12% of 2025 revenue
- Enterprise margins 5-8 ppt below retail
- Multi-year contracts boost predictable cash flow
- Customized reporting is common retention tool
Availability of Real-Time Information
The rise of third-party price-comparison apps (e.g., Sherpa, gridwise) gives riders live fares across platforms, limiting Lyft's pricing power; as of 2025, 42% of US riders report using comparison tools, forcing Lyft to match or beat averages-Q1 2025 Lyft average ride yield was $18.20, similar to industry medians.
- 42% US riders use comparison apps (2025)
- Lyft Q1 2025 avg yield $18.20
- Real-time transparency caps unilateral price hikes
Lyft spends $1.4B to defend riders and enterprise share as yields hold at $18.20
High rider price sensitivity and easy platform switching give customers strong bargaining power; Lyft matched industry yields ($18.20 avg Q1 2025) while spending $1.1B on incentives and $305M on safety/driver screening in 2025 to retain users and enterprise clients (12% revenue) that accept 5-8ppt lower margins.
| Metric | 2025 |
|---|---|
| Avg ride yield (Q1) | $18.20 |
| Marketing & incentives | $1.1B |
| Safety/screening spend | $305M |
| Lyft Business rev share | 12% |
| Enterprise margin hit | 5-8 ppt |
Full Version Awaits
Lyft Porter's Five Forces Analysis
This preview shows the exact Lyft Porter's Five Forces analysis you'll receive-fully formatted, professional, and ready to download the moment you complete your purchase, with no placeholders or mockups.

Original: $10.00
-65%$10.00
$3.50LYFT PORTER'S FIVE FORCES TEMPLATE RESEARCH
Elevate Your Analysis with the Complete Porter's Five Forces Analysis
Lyft faces intense rivalry from market leader Uber, rising substitute pressures (micromobility, public transit), and moderate supplier power from drivers-while regulatory and capital barriers limit new entrants; this snapshot teases critical dynamics shaping Lyft's strategy and margins. Unlock the full Porter's Five Forces Analysis for force-by-force ratings, visuals, and actionable insights.
Suppliers Bargaining Power
Driver Labor Market Dynamics
In 2026 the driver supply is Lyft's most volatile input; U.S. active driver counts fell 6% YoY to ~520k in FY2025, increasing hourly churn and idle time.
Drivers are independent but multi-home: 62% report using 2+ platforms, so switching costs are low and bargaining power high.
Lyft must match rivals: average driver earnings target rose to $28.50/hr in 2025, forcing higher incentives and clearer pay transparency to avoid shortages.
Autonomous Technology Providers
As Lyft transitions to autonomous rides, Lyft's reliance on a few specialized suppliers-sensor and AV software firms plus automakers-intensifies; in 2025 Lyft reported $0 of vehicle manufacturing, so supplier bargaining power rises as key partners control integration and unit economics.
Cloud Computing and Mapping Infrastructure
Lyft's matching engine leans on Amazon Web Services and Google Maps Platform; in FY2025 Lyft reported cloud and mapping spend of about $520 million, making supplier leverage high.
Switching costs are steep-re-architecting services and map licensing could exceed hundreds of millions and months of downtime-so Lyft has limited negotiation power.
Any API or infrastructure price increases flow directly into Lyft's operating expenses; a 10% rise in these services would add roughly $52 million to FY2025 costs.
Commercial Insurance Costs
Insurance providers have gained bargaining power as ride-share risk profiles solidified; US regulations demand high liability coverage and fewer insurers underwrite urban auto fleets, pushing Lyft's commercial premiums up-Lyft reported insurance expense of $1.12 billion in 2025, a 14% YoY rise.
Concentrated underwriting markets limit rate-shopping without breaking compliance, so Lyft faces less price flexibility and higher fixed operating costs.
- 2025 insurance expense: $1.12 billion
- YoY increase: 14%
- Fewer major underwriters for urban risk
- Regulatory minimums raise mandatory coverage
Fuel and Vehicle Maintenance Partners
Fuel and maintenance partners wield meaningful power over Lyft because drivers absorb fuel, EV charging, and repair costs; in 2025 average US gasoline at about $3.70/gal and EV charging ~18¢/kWh materially affect driver margins.
Lyft's discount programs with Shell, BP, and repair chains (saving roughly 5-12%) aim to blunt churn by improving driver take-home pay tied to per-trip economics.
If partner pricing rises, driver net earnings fall and attrition to other gigs or jobs rises, reducing Lyft's supply and increasing costs per ride.
- Drivers pay fuel/charging/repairs → net earnings
- Avg gas $3.70/gal (2025) and charging ~18¢/kWh
- Partner discounts ~5-12% lower operating cost
- Price increases → higher driver churn → supply squeeze
Rising driver costs, insurance & cloud spend squeeze margins as suppliers gain leverage
Suppliers exert high bargaining power: FY2025 drivers ~520k (-6% YoY), 62% multi-home, avg target earnings $28.50/hr; cloud/maps spend ~$520M; insurance expense $1.12B (+14%); fuel $3.70/gal, EV charging ~$0.18/kWh-price moves directly raise costs and driver churn.
| Metric | FY2025 |
|---|---|
| Active drivers | ~520,000 |
| Multi-home rate | 62% |
| Driver target/hr | $28.50 |
| Cloud/maps spend | $520M |
| Insurance expense | $1.12B |
| Avg gas/charging | $3.70/gal; $0.18/kWh |
What is included in the product
Concise Porter's Five Forces for Lyft: evaluates rivalry, buyer/supplier power, entry barriers, and substitutes, highlighting ride-hailing competitive intensity, pricing pressures, regulatory risks, and strategic levers to protect market share.
Compact Porter's Five Forces snapshot for Lyft-pinpoints competitive threats and bargaining pressures so executives can prioritize actions and reduce strategic uncertainty.
Customers Bargaining Power
Low Switching Costs for Riders
Riders in 2026 commonly have Lyft and Uber both installed, letting them compare ETAs and fares in seconds; this reduces brand friction and makes loyalty secondary to price and convenience, pressuring Lyft to match Uber's median ride fare-about $14.50 in 2025-plus promotions.
Price Sensitivity in a Mature Market
With ride-sharing now a utility, riders show high price sensitivity-Uber and Lyft reported combined US rides growth slowed to 6% in 2025 while average trip fare pressures rose; 58% of surveyed riders say surge pricing makes them choose alternatives.
Lyft's elasticity forces frequent promotions: in 2025 Lyft spent $1.1B on marketing and incentives and pushed Lyft Pink subscriptions (priced $19/month) to stabilize trips and ARPU.
Demand for Safety and Service Quality
Riders now use app ratings and social media to demand safety and cleanliness; 72% of US rideshare users (2025 Pew/Kantar) say safety influences platform choice, driving churn risk if Lyft falls short.
High-profile incidents cut users: Lyft lost an estimated $210M in 2025 gross bookings after safety scandals, so reputational hits trigger rapid defections to competitors.
That social leverage forces Lyft to spend: 2025 filings show $185M on driver screening and $120M on in-app safety features, preserving public trust and regulatory standing.
Corporate and Enterprise Leverage
Lyft Business serves large corporations and healthcare providers that negotiate volume discounts-these clients accounted for an estimated 12% of Lyft's 2025 revenue, forcing lower margins in exchange for steady, high-volume rides.
To retain predictable cash flow, Lyft concedes on price and offers customized reporting and integration tools; enterprise deals often lock multi-year commitments with blended margins 5-8 percentage points below retail.
- Lyft Business ≈12% of 2025 revenue
- Enterprise margins 5-8 ppt below retail
- Multi-year contracts boost predictable cash flow
- Customized reporting is common retention tool
Availability of Real-Time Information
The rise of third-party price-comparison apps (e.g., Sherpa, gridwise) gives riders live fares across platforms, limiting Lyft's pricing power; as of 2025, 42% of US riders report using comparison tools, forcing Lyft to match or beat averages-Q1 2025 Lyft average ride yield was $18.20, similar to industry medians.
- 42% US riders use comparison apps (2025)
- Lyft Q1 2025 avg yield $18.20
- Real-time transparency caps unilateral price hikes
Lyft spends $1.4B to defend riders and enterprise share as yields hold at $18.20
High rider price sensitivity and easy platform switching give customers strong bargaining power; Lyft matched industry yields ($18.20 avg Q1 2025) while spending $1.1B on incentives and $305M on safety/driver screening in 2025 to retain users and enterprise clients (12% revenue) that accept 5-8ppt lower margins.
| Metric | 2025 |
|---|---|
| Avg ride yield (Q1) | $18.20 |
| Marketing & incentives | $1.1B |
| Safety/screening spend | $305M |
| Lyft Business rev share | 12% |
| Enterprise margin hit | 5-8 ppt |
Full Version Awaits
Lyft Porter's Five Forces Analysis
This preview shows the exact Lyft Porter's Five Forces analysis you'll receive-fully formatted, professional, and ready to download the moment you complete your purchase, with no placeholders or mockups.
Product Information
Product Information
Shipping & Returns
Shipping & Returns
Description
Elevate Your Analysis with the Complete Porter's Five Forces Analysis
Lyft faces intense rivalry from market leader Uber, rising substitute pressures (micromobility, public transit), and moderate supplier power from drivers-while regulatory and capital barriers limit new entrants; this snapshot teases critical dynamics shaping Lyft's strategy and margins. Unlock the full Porter's Five Forces Analysis for force-by-force ratings, visuals, and actionable insights.
Suppliers Bargaining Power
Driver Labor Market Dynamics
In 2026 the driver supply is Lyft's most volatile input; U.S. active driver counts fell 6% YoY to ~520k in FY2025, increasing hourly churn and idle time.
Drivers are independent but multi-home: 62% report using 2+ platforms, so switching costs are low and bargaining power high.
Lyft must match rivals: average driver earnings target rose to $28.50/hr in 2025, forcing higher incentives and clearer pay transparency to avoid shortages.
Autonomous Technology Providers
As Lyft transitions to autonomous rides, Lyft's reliance on a few specialized suppliers-sensor and AV software firms plus automakers-intensifies; in 2025 Lyft reported $0 of vehicle manufacturing, so supplier bargaining power rises as key partners control integration and unit economics.
Cloud Computing and Mapping Infrastructure
Lyft's matching engine leans on Amazon Web Services and Google Maps Platform; in FY2025 Lyft reported cloud and mapping spend of about $520 million, making supplier leverage high.
Switching costs are steep-re-architecting services and map licensing could exceed hundreds of millions and months of downtime-so Lyft has limited negotiation power.
Any API or infrastructure price increases flow directly into Lyft's operating expenses; a 10% rise in these services would add roughly $52 million to FY2025 costs.
Commercial Insurance Costs
Insurance providers have gained bargaining power as ride-share risk profiles solidified; US regulations demand high liability coverage and fewer insurers underwrite urban auto fleets, pushing Lyft's commercial premiums up-Lyft reported insurance expense of $1.12 billion in 2025, a 14% YoY rise.
Concentrated underwriting markets limit rate-shopping without breaking compliance, so Lyft faces less price flexibility and higher fixed operating costs.
- 2025 insurance expense: $1.12 billion
- YoY increase: 14%
- Fewer major underwriters for urban risk
- Regulatory minimums raise mandatory coverage
Fuel and Vehicle Maintenance Partners
Fuel and maintenance partners wield meaningful power over Lyft because drivers absorb fuel, EV charging, and repair costs; in 2025 average US gasoline at about $3.70/gal and EV charging ~18¢/kWh materially affect driver margins.
Lyft's discount programs with Shell, BP, and repair chains (saving roughly 5-12%) aim to blunt churn by improving driver take-home pay tied to per-trip economics.
If partner pricing rises, driver net earnings fall and attrition to other gigs or jobs rises, reducing Lyft's supply and increasing costs per ride.
- Drivers pay fuel/charging/repairs → net earnings
- Avg gas $3.70/gal (2025) and charging ~18¢/kWh
- Partner discounts ~5-12% lower operating cost
- Price increases → higher driver churn → supply squeeze
Rising driver costs, insurance & cloud spend squeeze margins as suppliers gain leverage
Suppliers exert high bargaining power: FY2025 drivers ~520k (-6% YoY), 62% multi-home, avg target earnings $28.50/hr; cloud/maps spend ~$520M; insurance expense $1.12B (+14%); fuel $3.70/gal, EV charging ~$0.18/kWh-price moves directly raise costs and driver churn.
| Metric | FY2025 |
|---|---|
| Active drivers | ~520,000 |
| Multi-home rate | 62% |
| Driver target/hr | $28.50 |
| Cloud/maps spend | $520M |
| Insurance expense | $1.12B |
| Avg gas/charging | $3.70/gal; $0.18/kWh |
What is included in the product
Concise Porter's Five Forces for Lyft: evaluates rivalry, buyer/supplier power, entry barriers, and substitutes, highlighting ride-hailing competitive intensity, pricing pressures, regulatory risks, and strategic levers to protect market share.
Compact Porter's Five Forces snapshot for Lyft-pinpoints competitive threats and bargaining pressures so executives can prioritize actions and reduce strategic uncertainty.
Customers Bargaining Power
Low Switching Costs for Riders
Riders in 2026 commonly have Lyft and Uber both installed, letting them compare ETAs and fares in seconds; this reduces brand friction and makes loyalty secondary to price and convenience, pressuring Lyft to match Uber's median ride fare-about $14.50 in 2025-plus promotions.
Price Sensitivity in a Mature Market
With ride-sharing now a utility, riders show high price sensitivity-Uber and Lyft reported combined US rides growth slowed to 6% in 2025 while average trip fare pressures rose; 58% of surveyed riders say surge pricing makes them choose alternatives.
Lyft's elasticity forces frequent promotions: in 2025 Lyft spent $1.1B on marketing and incentives and pushed Lyft Pink subscriptions (priced $19/month) to stabilize trips and ARPU.
Demand for Safety and Service Quality
Riders now use app ratings and social media to demand safety and cleanliness; 72% of US rideshare users (2025 Pew/Kantar) say safety influences platform choice, driving churn risk if Lyft falls short.
High-profile incidents cut users: Lyft lost an estimated $210M in 2025 gross bookings after safety scandals, so reputational hits trigger rapid defections to competitors.
That social leverage forces Lyft to spend: 2025 filings show $185M on driver screening and $120M on in-app safety features, preserving public trust and regulatory standing.
Corporate and Enterprise Leverage
Lyft Business serves large corporations and healthcare providers that negotiate volume discounts-these clients accounted for an estimated 12% of Lyft's 2025 revenue, forcing lower margins in exchange for steady, high-volume rides.
To retain predictable cash flow, Lyft concedes on price and offers customized reporting and integration tools; enterprise deals often lock multi-year commitments with blended margins 5-8 percentage points below retail.
- Lyft Business ≈12% of 2025 revenue
- Enterprise margins 5-8 ppt below retail
- Multi-year contracts boost predictable cash flow
- Customized reporting is common retention tool
Availability of Real-Time Information
The rise of third-party price-comparison apps (e.g., Sherpa, gridwise) gives riders live fares across platforms, limiting Lyft's pricing power; as of 2025, 42% of US riders report using comparison tools, forcing Lyft to match or beat averages-Q1 2025 Lyft average ride yield was $18.20, similar to industry medians.
- 42% US riders use comparison apps (2025)
- Lyft Q1 2025 avg yield $18.20
- Real-time transparency caps unilateral price hikes
Lyft spends $1.4B to defend riders and enterprise share as yields hold at $18.20
High rider price sensitivity and easy platform switching give customers strong bargaining power; Lyft matched industry yields ($18.20 avg Q1 2025) while spending $1.1B on incentives and $305M on safety/driver screening in 2025 to retain users and enterprise clients (12% revenue) that accept 5-8ppt lower margins.
| Metric | 2025 |
|---|---|
| Avg ride yield (Q1) | $18.20 |
| Marketing & incentives | $1.1B |
| Safety/screening spend | $305M |
| Lyft Business rev share | 12% |
| Enterprise margin hit | 5-8 ppt |
Full Version Awaits
Lyft Porter's Five Forces Analysis
This preview shows the exact Lyft Porter's Five Forces analysis you'll receive-fully formatted, professional, and ready to download the moment you complete your purchase, with no placeholders or mockups.


