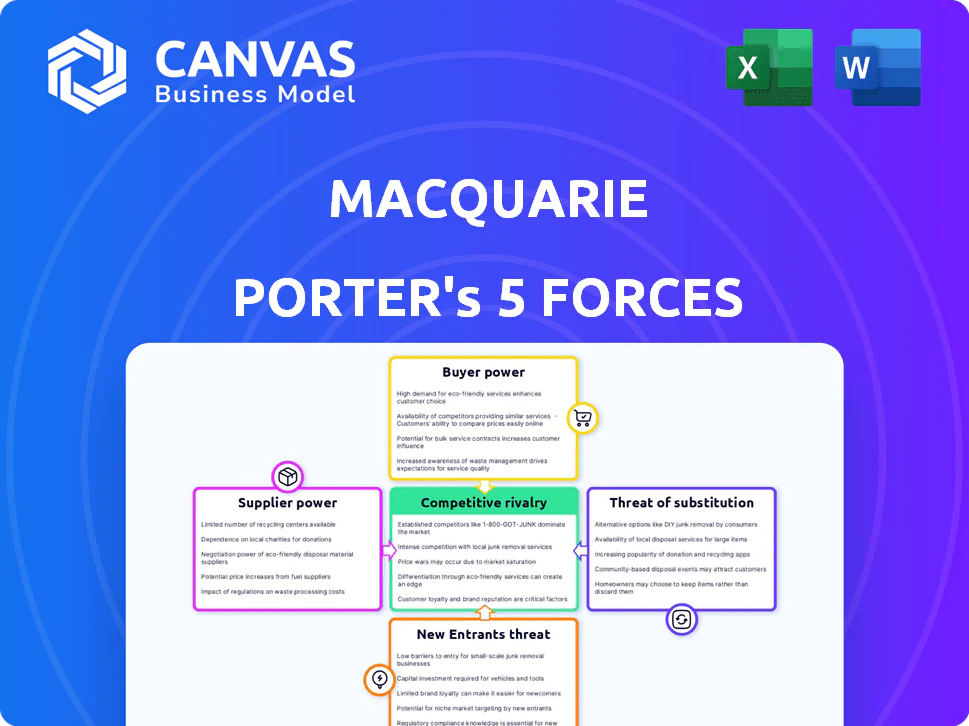
MACQUARIE PORTER'S FIVE FORCES TEMPLATE RESEARCH
Elevate Your Analysis with the Complete Porter's Five Forces Analysis
Macquarie operates in a capital-intense, highly regulated space where supplier relationships, client bargaining power, and substitute financial products shape its margins and growth prospects-this snapshot highlights key pressures and strategic levers.
Suppliers Bargaining Power
Specialized Human Capital and Talent Retention
The most significant suppliers for Macquarie Group are its specialized employees-especially in infrastructure, green energy, and commodities-with Macquarie paying average analyst bonuses of ~A$215,000 in FY2025 to retain talent.
By 2026, global competition for energy-transition talent has pushed top-tier professionals to demand 20-35% higher compensation and flexible work terms, raising Macquarie's cost of human capital.
Maintaining the 'Millionaire's Factory' reputation matters: Macquarie reported FY2025 profit before tax of A$4.1bn, enabling premium pay and promotions to secure specialists who manage complex global assets.
Wholesale Funding and Global Debt Markets
Macquarie relies heavily on international wholesale funding-A$78.2bn of debt and deposits in FY2025-making bondholders and global banks moderately powerful as suppliers. Their leverage rises when global liquidity tightens; a one-notch credit downgrade in 2025 would raise funding spreads by ~75-120bp. Market volatility in 2026 can thus quickly lift Macquarie's cost of funds and squeeze margins.

Technological Infrastructure and Cloud Providers
As Macquarie speeds digital transformation, reliance on a few global cloud/AI providers (AWS, Microsoft Azure, Google Cloud) raises supplier bargaining power-switching costs exceed millions and require bespoke financial-security controls; Macquarie reported ~A$600m FY2025 tech investments, highlighting exposure.
Macquarie uses multi-cloud to reduce single-vendor risk, yet vendor concentration persists: top cloud vendors control ~65-70% market share (2025 IDC), keeping pricing and contract leverage high and making supplier disruption a critical operational risk.
Central Banks and Regulatory Oversight
Central banks and regulators like the Reserve Bank of Australia and APRA act as suppliers of the capital and legal framework, exercising near-absolute power over Macquarie's balance sheet via capital adequacy and liquidity rules.
APRA's 2025 updates raised risk-weighted asset (RWA) floors and tightened CET1 targets, reducing usable capital for high-growth exposures; Macquarie Group Ltd reported CET1 ratio 11.2% at FY2025, down 0.6pp vs FY2024.
Result: stricter risk-weighting raises capital charges on infrastructure and lending, forcing Macquarie to shift toward lower-RWA assets and fee businesses.
- APRA 2025: higher RWA floors, tighter liquidity buffers
- Macquarie CET1 FY2025: 11.2% (-0.6pp YoY)
- Impact: less capital for high-growth, higher capital charge on infrastructure
Financial Data and Analytics Vendors
Macquarie relies on a few high-end data vendors-Bloomberg and Refinitiv-whose platforms are industry standards; loss of real-time feeds would paralyze Commodities & Global Markets, giving suppliers strong bargaining power.
2025 spend on market data is estimated at ~US$120-150m across global banks; these fees are largely fixed, non-negotiable overheads for trading and asset management operations.
- Few suppliers: Bloomberg, Refinitiv
- High dependence: real-time feeds critical
- 2025 market-data spend: ~US$120-150m benchmark
- Costs: fixed, non-negotiable, high bargaining power
Suppliers Squeeze Margins: Staffing, Funding, Tech and Data Drive Costs Up
Suppliers hold moderate-to-high power: scarce specialist staff (avg FY2025 analyst bonus A$215,000), wholesale funding (A$78.2bn debt & deposits FY2025), concentrated cloud vendors (~65-70% market share) and market-data providers (US$120-150m benchmark spend) plus APRA rules (CET1 11.2% FY2025) raise costs and constrain capital.
| Supplier | FY2025 Metric |
|---|---|
| Analyst bonuses | A$215,000 |
| Debt & deposits | A$78.2bn |
| Tech spend | A$600m |
| Market-data | US$120-150m |
| CET1 ratio | 11.2% |
What is included in the product
Tailored exclusively for Macquarie, this Porter's Five Forces overview identifies competitive intensity, customer and supplier leverage, entry barriers, and substitute threats-highlighting strategic risks and opportunities shaping Macquarie's profitability and market positioning.
Concise Porter's Five Forces snapshot for Macquarie-quickly spot threat hotspots and strategic levers to relieve competitive pressure.
Customers Bargaining Power
Institutional Investors in Infrastructure Funds
Large pension and sovereign wealth funds-Macquarie Asset Management's core clients-committed roughly US$150bn to infrastructure strategies in 2025, giving them strong leverage to demand lower fees and clearer ESG metrics.
By 2026, pension consolidation concentrated buying power-top 50 funds control ~45% of global assets-pushing Macquarie to expand co‑investment offers and fee‑for-performance structures.
Retail Banking and Mortgage Borrowers
In Australia, retail customers wield high bargaining power versus Macquarie Bank because switching costs are low and the Big Four hold 76% of home loan balances in 2025, so customers move easily between lenders.
Open banking and digital comparison tools launched widely in 2025 increased transparency; 42% of mortgage holders shopped rates that year, forcing Macquarie to match prices and improve digital UX.

Corporate Advisory and M&A Clients
Large corporates seeking M&A or capital raises face many global banks, so bargaining power is moderate-high; global M&A fees reached about $135bn in 2025, intensifying competition for mandates.
Clients run beauty parades, forcing Macquarie to show sector depth and faster execution; Macquarie advised on deals totaling roughly $48bn in FY2025, underscoring execution focus.
Winning relies on long-term relationships over fee cuts; repeat-client ratios and multi-year mandates drive value more than one-off pricing in advisory engagements.
Commodity Hedging and Trading Counterparties
Corporate energy and resources clients use Macquarie for complex hedging; in FY2025 Macquarie Group reported commodity markets revenue of A$3.2bn, reflecting strong client flows. These clients have moderate bargaining power: they need specialized liquidity but can shift to Goldman Sachs or trading houses. Macquarie's integrated physical-plus-financial platform-over 60% of commodities trading tied to physical assets-limits pure-play rivals' ability to replicate its offering.
- FY2025 commodities revenue A$3.2bn
- Clients moderate power: alternative global banks/traders
- Integrated physical+financial edge: ~60% physical-linked trades
Wealth Management and High Net Worth Individuals
Wealthy individuals and family offices exert high bargaining power, demanding personalized service and top risk-adjusted returns; Macquarie reported $A1.1 trillion assets under management (FY2025) which helps but doesn't remove pressure.
These clients are mobile and shift assets quickly-industry data shows UHNW net flows favor managers offering alternatives; Macquarie's exclusive infrastructure deals (A$12.3bn deployed in 2025) help retain them.
- High bargaining power: bespoke demands
- UHNW mobility: rapid reallocation risk
- Macquarie AUM FY2025: A$1.1tn
- Infrastructure deploys 2025: A$12.3bn (retention tool)
Customers Drive Fees Down: Funds, Mortgage Shoppers & Corporates Hold the Power
Customers hold high bargaining power: large funds (US$150bn infrastructure commitments in 2025) push fee cuts and ESG clarity, retail mortgage shoppers (42% shopped rates in 2025) force price/UX matches, corporates have moderate‑high power amid $135bn global M&A fees (2025), while Macquarie's AUM A$1.1tn and A$3.2bn commodities revenue (FY2025) and A$12.3bn infrastructure deploys limit churn.
| Metric | 2025 Value |
|---|---|
| Infra commitments (large funds) | US$150bn |
| Mortgage shoppers | 42% |
| Global M&A fees | $135bn |
| Macquarie AUM | A$1.1tn |
| Commodities revenue | A$3.2bn |
| Infrastructure deploys | A$12.3bn |
Preview the Actual Deliverable
Macquarie Porter's Five Forces Analysis
This preview shows the exact Macquarie Porter's Five Forces analysis you'll receive immediately after purchase-fully formatted, professionally written, and ready to download with no placeholders or samples.

Original: $10.00
-65%$10.00
$3.50MACQUARIE PORTER'S FIVE FORCES TEMPLATE RESEARCH
Elevate Your Analysis with the Complete Porter's Five Forces Analysis
Macquarie operates in a capital-intense, highly regulated space where supplier relationships, client bargaining power, and substitute financial products shape its margins and growth prospects-this snapshot highlights key pressures and strategic levers.
Suppliers Bargaining Power
Specialized Human Capital and Talent Retention
The most significant suppliers for Macquarie Group are its specialized employees-especially in infrastructure, green energy, and commodities-with Macquarie paying average analyst bonuses of ~A$215,000 in FY2025 to retain talent.
By 2026, global competition for energy-transition talent has pushed top-tier professionals to demand 20-35% higher compensation and flexible work terms, raising Macquarie's cost of human capital.
Maintaining the 'Millionaire's Factory' reputation matters: Macquarie reported FY2025 profit before tax of A$4.1bn, enabling premium pay and promotions to secure specialists who manage complex global assets.
Wholesale Funding and Global Debt Markets
Macquarie relies heavily on international wholesale funding-A$78.2bn of debt and deposits in FY2025-making bondholders and global banks moderately powerful as suppliers. Their leverage rises when global liquidity tightens; a one-notch credit downgrade in 2025 would raise funding spreads by ~75-120bp. Market volatility in 2026 can thus quickly lift Macquarie's cost of funds and squeeze margins.
Technological Infrastructure and Cloud Providers
As Macquarie speeds digital transformation, reliance on a few global cloud/AI providers (AWS, Microsoft Azure, Google Cloud) raises supplier bargaining power-switching costs exceed millions and require bespoke financial-security controls; Macquarie reported ~A$600m FY2025 tech investments, highlighting exposure.
Macquarie uses multi-cloud to reduce single-vendor risk, yet vendor concentration persists: top cloud vendors control ~65-70% market share (2025 IDC), keeping pricing and contract leverage high and making supplier disruption a critical operational risk.
Central Banks and Regulatory Oversight
Central banks and regulators like the Reserve Bank of Australia and APRA act as suppliers of the capital and legal framework, exercising near-absolute power over Macquarie's balance sheet via capital adequacy and liquidity rules.
APRA's 2025 updates raised risk-weighted asset (RWA) floors and tightened CET1 targets, reducing usable capital for high-growth exposures; Macquarie Group Ltd reported CET1 ratio 11.2% at FY2025, down 0.6pp vs FY2024.
Result: stricter risk-weighting raises capital charges on infrastructure and lending, forcing Macquarie to shift toward lower-RWA assets and fee businesses.
- APRA 2025: higher RWA floors, tighter liquidity buffers
- Macquarie CET1 FY2025: 11.2% (-0.6pp YoY)
- Impact: less capital for high-growth, higher capital charge on infrastructure
Financial Data and Analytics Vendors
Macquarie relies on a few high-end data vendors-Bloomberg and Refinitiv-whose platforms are industry standards; loss of real-time feeds would paralyze Commodities & Global Markets, giving suppliers strong bargaining power.
2025 spend on market data is estimated at ~US$120-150m across global banks; these fees are largely fixed, non-negotiable overheads for trading and asset management operations.
- Few suppliers: Bloomberg, Refinitiv
- High dependence: real-time feeds critical
- 2025 market-data spend: ~US$120-150m benchmark
- Costs: fixed, non-negotiable, high bargaining power
Suppliers Squeeze Margins: Staffing, Funding, Tech and Data Drive Costs Up
Suppliers hold moderate-to-high power: scarce specialist staff (avg FY2025 analyst bonus A$215,000), wholesale funding (A$78.2bn debt & deposits FY2025), concentrated cloud vendors (~65-70% market share) and market-data providers (US$120-150m benchmark spend) plus APRA rules (CET1 11.2% FY2025) raise costs and constrain capital.
| Supplier | FY2025 Metric |
|---|---|
| Analyst bonuses | A$215,000 |
| Debt & deposits | A$78.2bn |
| Tech spend | A$600m |
| Market-data | US$120-150m |
| CET1 ratio | 11.2% |
What is included in the product
Tailored exclusively for Macquarie, this Porter's Five Forces overview identifies competitive intensity, customer and supplier leverage, entry barriers, and substitute threats-highlighting strategic risks and opportunities shaping Macquarie's profitability and market positioning.
Concise Porter's Five Forces snapshot for Macquarie-quickly spot threat hotspots and strategic levers to relieve competitive pressure.
Customers Bargaining Power
Institutional Investors in Infrastructure Funds
Large pension and sovereign wealth funds-Macquarie Asset Management's core clients-committed roughly US$150bn to infrastructure strategies in 2025, giving them strong leverage to demand lower fees and clearer ESG metrics.
By 2026, pension consolidation concentrated buying power-top 50 funds control ~45% of global assets-pushing Macquarie to expand co‑investment offers and fee‑for-performance structures.
Retail Banking and Mortgage Borrowers
In Australia, retail customers wield high bargaining power versus Macquarie Bank because switching costs are low and the Big Four hold 76% of home loan balances in 2025, so customers move easily between lenders.
Open banking and digital comparison tools launched widely in 2025 increased transparency; 42% of mortgage holders shopped rates that year, forcing Macquarie to match prices and improve digital UX.
Corporate Advisory and M&A Clients
Large corporates seeking M&A or capital raises face many global banks, so bargaining power is moderate-high; global M&A fees reached about $135bn in 2025, intensifying competition for mandates.
Clients run beauty parades, forcing Macquarie to show sector depth and faster execution; Macquarie advised on deals totaling roughly $48bn in FY2025, underscoring execution focus.
Winning relies on long-term relationships over fee cuts; repeat-client ratios and multi-year mandates drive value more than one-off pricing in advisory engagements.
Commodity Hedging and Trading Counterparties
Corporate energy and resources clients use Macquarie for complex hedging; in FY2025 Macquarie Group reported commodity markets revenue of A$3.2bn, reflecting strong client flows. These clients have moderate bargaining power: they need specialized liquidity but can shift to Goldman Sachs or trading houses. Macquarie's integrated physical-plus-financial platform-over 60% of commodities trading tied to physical assets-limits pure-play rivals' ability to replicate its offering.
- FY2025 commodities revenue A$3.2bn
- Clients moderate power: alternative global banks/traders
- Integrated physical+financial edge: ~60% physical-linked trades
Wealth Management and High Net Worth Individuals
Wealthy individuals and family offices exert high bargaining power, demanding personalized service and top risk-adjusted returns; Macquarie reported $A1.1 trillion assets under management (FY2025) which helps but doesn't remove pressure.
These clients are mobile and shift assets quickly-industry data shows UHNW net flows favor managers offering alternatives; Macquarie's exclusive infrastructure deals (A$12.3bn deployed in 2025) help retain them.
- High bargaining power: bespoke demands
- UHNW mobility: rapid reallocation risk
- Macquarie AUM FY2025: A$1.1tn
- Infrastructure deploys 2025: A$12.3bn (retention tool)
Customers Drive Fees Down: Funds, Mortgage Shoppers & Corporates Hold the Power
Customers hold high bargaining power: large funds (US$150bn infrastructure commitments in 2025) push fee cuts and ESG clarity, retail mortgage shoppers (42% shopped rates in 2025) force price/UX matches, corporates have moderate‑high power amid $135bn global M&A fees (2025), while Macquarie's AUM A$1.1tn and A$3.2bn commodities revenue (FY2025) and A$12.3bn infrastructure deploys limit churn.
| Metric | 2025 Value |
|---|---|
| Infra commitments (large funds) | US$150bn |
| Mortgage shoppers | 42% |
| Global M&A fees | $135bn |
| Macquarie AUM | A$1.1tn |
| Commodities revenue | A$3.2bn |
| Infrastructure deploys | A$12.3bn |
Preview the Actual Deliverable
Macquarie Porter's Five Forces Analysis
This preview shows the exact Macquarie Porter's Five Forces analysis you'll receive immediately after purchase-fully formatted, professionally written, and ready to download with no placeholders or samples.
Product Information
Product Information
Shipping & Returns
Shipping & Returns
Description
Elevate Your Analysis with the Complete Porter's Five Forces Analysis
Macquarie operates in a capital-intense, highly regulated space where supplier relationships, client bargaining power, and substitute financial products shape its margins and growth prospects-this snapshot highlights key pressures and strategic levers.
Suppliers Bargaining Power
Specialized Human Capital and Talent Retention
The most significant suppliers for Macquarie Group are its specialized employees-especially in infrastructure, green energy, and commodities-with Macquarie paying average analyst bonuses of ~A$215,000 in FY2025 to retain talent.
By 2026, global competition for energy-transition talent has pushed top-tier professionals to demand 20-35% higher compensation and flexible work terms, raising Macquarie's cost of human capital.
Maintaining the 'Millionaire's Factory' reputation matters: Macquarie reported FY2025 profit before tax of A$4.1bn, enabling premium pay and promotions to secure specialists who manage complex global assets.
Wholesale Funding and Global Debt Markets
Macquarie relies heavily on international wholesale funding-A$78.2bn of debt and deposits in FY2025-making bondholders and global banks moderately powerful as suppliers. Their leverage rises when global liquidity tightens; a one-notch credit downgrade in 2025 would raise funding spreads by ~75-120bp. Market volatility in 2026 can thus quickly lift Macquarie's cost of funds and squeeze margins.
Technological Infrastructure and Cloud Providers
As Macquarie speeds digital transformation, reliance on a few global cloud/AI providers (AWS, Microsoft Azure, Google Cloud) raises supplier bargaining power-switching costs exceed millions and require bespoke financial-security controls; Macquarie reported ~A$600m FY2025 tech investments, highlighting exposure.
Macquarie uses multi-cloud to reduce single-vendor risk, yet vendor concentration persists: top cloud vendors control ~65-70% market share (2025 IDC), keeping pricing and contract leverage high and making supplier disruption a critical operational risk.
Central Banks and Regulatory Oversight
Central banks and regulators like the Reserve Bank of Australia and APRA act as suppliers of the capital and legal framework, exercising near-absolute power over Macquarie's balance sheet via capital adequacy and liquidity rules.
APRA's 2025 updates raised risk-weighted asset (RWA) floors and tightened CET1 targets, reducing usable capital for high-growth exposures; Macquarie Group Ltd reported CET1 ratio 11.2% at FY2025, down 0.6pp vs FY2024.
Result: stricter risk-weighting raises capital charges on infrastructure and lending, forcing Macquarie to shift toward lower-RWA assets and fee businesses.
- APRA 2025: higher RWA floors, tighter liquidity buffers
- Macquarie CET1 FY2025: 11.2% (-0.6pp YoY)
- Impact: less capital for high-growth, higher capital charge on infrastructure
Financial Data and Analytics Vendors
Macquarie relies on a few high-end data vendors-Bloomberg and Refinitiv-whose platforms are industry standards; loss of real-time feeds would paralyze Commodities & Global Markets, giving suppliers strong bargaining power.
2025 spend on market data is estimated at ~US$120-150m across global banks; these fees are largely fixed, non-negotiable overheads for trading and asset management operations.
- Few suppliers: Bloomberg, Refinitiv
- High dependence: real-time feeds critical
- 2025 market-data spend: ~US$120-150m benchmark
- Costs: fixed, non-negotiable, high bargaining power
Suppliers Squeeze Margins: Staffing, Funding, Tech and Data Drive Costs Up
Suppliers hold moderate-to-high power: scarce specialist staff (avg FY2025 analyst bonus A$215,000), wholesale funding (A$78.2bn debt & deposits FY2025), concentrated cloud vendors (~65-70% market share) and market-data providers (US$120-150m benchmark spend) plus APRA rules (CET1 11.2% FY2025) raise costs and constrain capital.
| Supplier | FY2025 Metric |
|---|---|
| Analyst bonuses | A$215,000 |
| Debt & deposits | A$78.2bn |
| Tech spend | A$600m |
| Market-data | US$120-150m |
| CET1 ratio | 11.2% |
What is included in the product
Tailored exclusively for Macquarie, this Porter's Five Forces overview identifies competitive intensity, customer and supplier leverage, entry barriers, and substitute threats-highlighting strategic risks and opportunities shaping Macquarie's profitability and market positioning.
Concise Porter's Five Forces snapshot for Macquarie-quickly spot threat hotspots and strategic levers to relieve competitive pressure.
Customers Bargaining Power
Institutional Investors in Infrastructure Funds
Large pension and sovereign wealth funds-Macquarie Asset Management's core clients-committed roughly US$150bn to infrastructure strategies in 2025, giving them strong leverage to demand lower fees and clearer ESG metrics.
By 2026, pension consolidation concentrated buying power-top 50 funds control ~45% of global assets-pushing Macquarie to expand co‑investment offers and fee‑for-performance structures.
Retail Banking and Mortgage Borrowers
In Australia, retail customers wield high bargaining power versus Macquarie Bank because switching costs are low and the Big Four hold 76% of home loan balances in 2025, so customers move easily between lenders.
Open banking and digital comparison tools launched widely in 2025 increased transparency; 42% of mortgage holders shopped rates that year, forcing Macquarie to match prices and improve digital UX.
Corporate Advisory and M&A Clients
Large corporates seeking M&A or capital raises face many global banks, so bargaining power is moderate-high; global M&A fees reached about $135bn in 2025, intensifying competition for mandates.
Clients run beauty parades, forcing Macquarie to show sector depth and faster execution; Macquarie advised on deals totaling roughly $48bn in FY2025, underscoring execution focus.
Winning relies on long-term relationships over fee cuts; repeat-client ratios and multi-year mandates drive value more than one-off pricing in advisory engagements.
Commodity Hedging and Trading Counterparties
Corporate energy and resources clients use Macquarie for complex hedging; in FY2025 Macquarie Group reported commodity markets revenue of A$3.2bn, reflecting strong client flows. These clients have moderate bargaining power: they need specialized liquidity but can shift to Goldman Sachs or trading houses. Macquarie's integrated physical-plus-financial platform-over 60% of commodities trading tied to physical assets-limits pure-play rivals' ability to replicate its offering.
- FY2025 commodities revenue A$3.2bn
- Clients moderate power: alternative global banks/traders
- Integrated physical+financial edge: ~60% physical-linked trades
Wealth Management and High Net Worth Individuals
Wealthy individuals and family offices exert high bargaining power, demanding personalized service and top risk-adjusted returns; Macquarie reported $A1.1 trillion assets under management (FY2025) which helps but doesn't remove pressure.
These clients are mobile and shift assets quickly-industry data shows UHNW net flows favor managers offering alternatives; Macquarie's exclusive infrastructure deals (A$12.3bn deployed in 2025) help retain them.
- High bargaining power: bespoke demands
- UHNW mobility: rapid reallocation risk
- Macquarie AUM FY2025: A$1.1tn
- Infrastructure deploys 2025: A$12.3bn (retention tool)
Customers Drive Fees Down: Funds, Mortgage Shoppers & Corporates Hold the Power
Customers hold high bargaining power: large funds (US$150bn infrastructure commitments in 2025) push fee cuts and ESG clarity, retail mortgage shoppers (42% shopped rates in 2025) force price/UX matches, corporates have moderate‑high power amid $135bn global M&A fees (2025), while Macquarie's AUM A$1.1tn and A$3.2bn commodities revenue (FY2025) and A$12.3bn infrastructure deploys limit churn.
| Metric | 2025 Value |
|---|---|
| Infra commitments (large funds) | US$150bn |
| Mortgage shoppers | 42% |
| Global M&A fees | $135bn |
| Macquarie AUM | A$1.1tn |
| Commodities revenue | A$3.2bn |
| Infrastructure deploys | A$12.3bn |
Preview the Actual Deliverable
Macquarie Porter's Five Forces Analysis
This preview shows the exact Macquarie Porter's Five Forces analysis you'll receive immediately after purchase-fully formatted, professionally written, and ready to download with no placeholders or samples.


