MERCHANTS FLEET PORTER'S FIVE FORCES TEMPLATE RESEARCH
What is included in the product
Tailored exclusively for Merchants Fleet, analyzing its position within its competitive landscape.
Instantly see competitive intensity through clear force visualizations—perfect for strategic planning.
Full Version Awaits
Merchants Fleet Porter's Five Forces Analysis
This preview showcases the complete Porter's Five Forces analysis for Merchants Fleet. The document presented here is the exact, fully realized analysis you'll receive after your purchase. It's professionally formatted and ready for immediate application to your specific needs. The document requires no further customization or setup. This is the final, ready-to-use deliverable.

Porter's Five Forces Analysis Template
From Overview to Strategy Blueprint
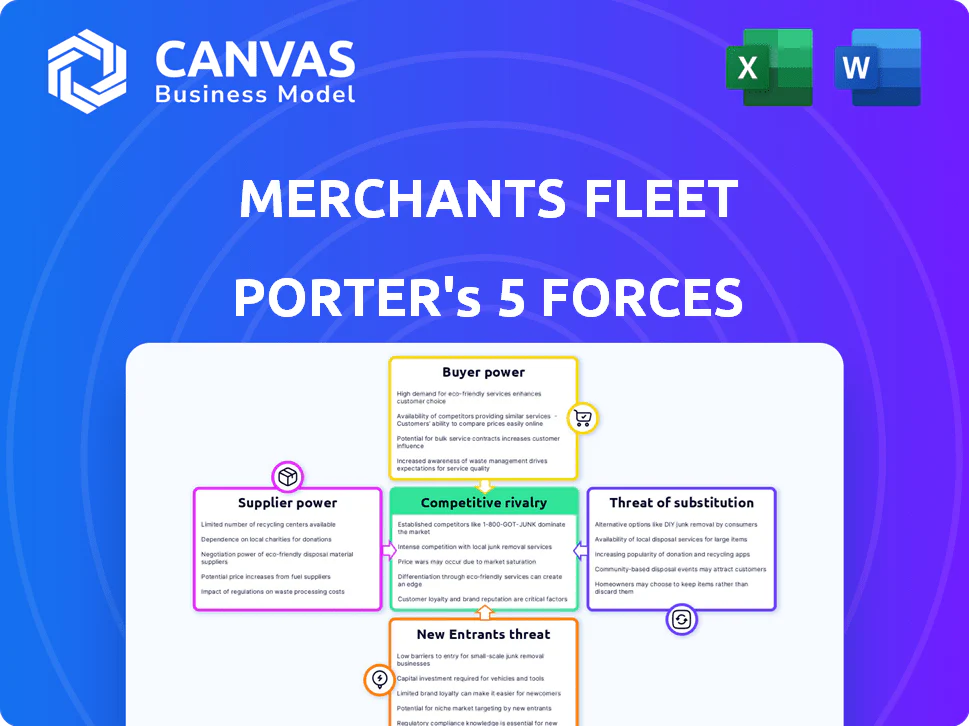
Merchants Fleet faces complex competitive pressures. Buyer power is moderate due to diverse customer segments and contract options. Suppliers hold limited influence with a fragmented landscape. The threat of new entrants is low, given industry barriers. Substitute threats are manageable, but evolving. Rivalry is intense with key players vying for market share.
Our full Porter's Five Forces report goes deeper—offering a data-driven framework to understand Merchants Fleet's real business risks and market opportunities.
Suppliers Bargaining Power
Vehicle Manufacturers
Merchants Fleet, as a fleet management company, is highly dependent on vehicle manufacturers for its vehicle supply. The concentration within the automotive industry, with a few major players, gives these manufacturers considerable pricing power. Supply chain issues, like the 2021-2023 semiconductor shortage, further strengthened their position, increasing vehicle acquisition costs. For example, the average transaction price for a new vehicle in December 2023 was about $47,928, up from $46,668 in December 2022, impacting fleet costs.
Technology Providers
Technology providers offer crucial fleet management solutions, giving them bargaining power. Their specialized telematics, software, and data analytics are key. Switching costs for Merchants Fleet are a factor. The uniqueness of offerings impacts pricing and terms. In 2024, the fleet management software market is valued at approximately $19 billion.

Maintenance and Repair Services
The bargaining power of maintenance and repair service providers significantly affects Merchants Fleet. The availability of qualified technicians and parts directly influences operating costs. A scarcity of skilled labor or limited parts availability strengthens the service providers' position. For instance, in 2024, the average cost for commercial vehicle maintenance increased by 7%, impacting fleet operations. This increase underscores the importance of managing these supplier relationships.
Fuel and Energy Providers
Fuel and energy providers wield significant bargaining power, influencing Merchants Fleet's operational costs. Price volatility in gasoline and diesel, alongside the rollout of EV charging infrastructure, directly impacts expenses. For instance, in 2024, the average price of regular gasoline fluctuated, affecting fleet budgets. The shift to EVs introduces dependence on electricity providers, adding another layer of cost consideration.
- Fuel prices rose in early 2024, peaking in the summer before easing slightly.
- EV charging infrastructure expansion varies regionally, impacting operational efficiency.
- Electricity costs for EVs present a new variable in fleet budgeting.
- Alternative fuel options add complexity to supply chain management.
Financing and Capital Providers
For Merchants Fleet, the bargaining power of financing and capital providers significantly impacts operations. Access to favorable financing terms from banks and financial institutions directly affects the cost of acquiring and maintaining its vehicle fleet. In 2024, interest rates and credit availability will be key factors influencing Merchants Fleet's profitability and expansion strategies. The company must manage its relationships with lenders to secure competitive funding rates.
- Interest rate hikes in 2023-2024 have increased borrowing costs.
- Access to capital determines fleet growth pace.
- Financial stability of providers matters.
- Merchants Fleet needs diverse funding sources.
Fleet Costs: A Multi-Supplier Challenge
Merchants Fleet faces supplier power from multiple fronts. Vehicle manufacturers' pricing power is significant due to industry concentration. Technology providers’ specialized solutions also influence pricing. Maintenance, fuel, and financing providers further impact costs.
| Supplier Type | Impact | 2024 Data |
|---|---|---|
| Vehicle Manufacturers | High pricing power | Avg. new vehicle price: ~$47,928 (Dec 2023) |
| Technology Providers | Influences pricing | Fleet software market: ~$19B |
| Maintenance/Repair | Affects operating costs | Commercial vehicle maintenance cost increase: 7% |
| Fuel/Energy | Impacts expenses | Gasoline prices fluctuated |
| Financing | Affects fleet costs | Interest rates increased |
Customers Bargaining Power
Large Fleet Operators
Large fleet operators wield considerable bargaining power because of the substantial business volume they control. These customers, representing significant revenue streams, can push for advantageous pricing, service customizations, and contract terms. For example, in 2024, fleet operators managing over 1,000 vehicles secured discounts averaging 7% on new vehicle purchases. Their negotiating leverage stems from the ability to shift substantial orders, affecting a vendor's market share. Consequently, vendors often concede to maintain these crucial, high-volume accounts.
Diverse Customer Base
Merchants Fleet's diverse customer base, encompassing businesses and government entities, reduces customer bargaining power. This distribution across various industries prevents any single customer segment from heavily influencing pricing or terms. For example, in 2024, no single customer accounted for more than 10% of revenue, showing a balanced customer portfolio.

Availability of Alternatives
Customers of Merchants Fleet have considerable bargaining power due to the availability of alternatives. They can choose from various fleet management providers, or opt for in-house fleet management. The ease of switching to competitors, like Enterprise Fleet Management, significantly boosts customer leverage. In 2024, the fleet management market was estimated at over $30 billion, highlighting numerous options.
Price Sensitivity
Customers, particularly those with extensive vehicle fleets, are notably price-conscious. Their primary goal is to cut operational expenses, which gives them considerable bargaining power. This emphasis on cost-effectiveness allows them to drive favorable pricing terms. In 2024, the average fleet operating cost was around $0.80 per mile, making price a critical factor.
- Fleet managers often negotiate aggressively to lower per-vehicle costs.
- Cost-saving solutions are actively sought to reduce expenditures.
- Price sensitivity impacts vendor selection in the fleet industry.
- Large fleet operators can demand discounts due to volume.
Industry-Specific Needs
Different industries have distinct fleet demands. Customers in last-mile delivery or transitioning to electric vehicles (EVs) may wield more bargaining power. This is due to the specialized nature of their needs. The availability of providers meeting these unique requirements varies. Consider that in 2024, EV fleet adoption grew by 35% across various sectors.
- Last-mile delivery companies often seek specific vehicle configurations.
- EV adoption rates influence customer bargaining power.
- Specialized needs increase customer leverage.
- Provider availability impacts negotiating strength.
Fleet Management Dynamics: Bargaining Power & Market Size
Customer bargaining power at Merchants Fleet varies, with large fleet operators having more leverage due to volume. They negotiate better terms, impacting pricing and service. The fleet management market, valued at over $30B in 2024, offers customers diverse choices.
| Factor | Impact | 2024 Data |
|---|---|---|
| Fleet Size | Higher bargaining power | 7% discount for fleets >1,000 vehicles |
| Market Competition | Increased leverage | $30B+ fleet management market |
| Cost Focus | Stronger negotiation | Avg. operating cost ~$0.80/mile |
Rivalry Among Competitors
Number and Diversity of Competitors
The fleet management market features numerous competitors, from giants like Enterprise Fleet Management to smaller regional players. This wide range of competitors leads to intense rivalry. In 2024, the top 10 fleet management companies controlled about 60% of the market share, indicating significant competition. This fragmentation ensures that no single company can dominate, fostering a battle for market share and customer acquisition.
Market Growth Rate
The fleet management market is booming, fueled by e-commerce and tech adoption. This growth, though positive, intensifies the battle for market share. The global fleet management market was valued at $23.17 billion in 2023. It is expected to reach $44.73 billion by 2030. This expansion creates both opportunities and fierce competition.

Differentiation of Services
Fleet management companies vie for market share by offering diverse services like leasing, maintenance, and telematics. Merchants Fleet's ability to stand out hinges on its service differentiation, especially in electric vehicle (EV) solutions and tech. In 2024, the EV fleet market expanded, with Merchants Fleet strategically positioning itself. Merchants Fleet's investments in technology are key to its competitive edge.
Switching Costs for Customers
Switching costs for customers in the fleet management industry are present, but not always a major barrier. While customers can switch providers, doing so might mean dealing with contract terms or data migration. Lower switching costs can increase rivalry as customers have a simple path to move to another option. According to a 2024 report by the Automotive Fleet, the average fleet turnover rate is about 25%, indicating a moderate level of customer mobility.
- Contractual obligations might lock customers into a specific provider.
- Data migration can be complicated, causing downtime or data loss.
- Some providers offer incentives to reduce switching costs.
- The level of customer satisfaction can affect the decision to switch.
Industry Consolidation
The fleet management sector has experienced consolidation, with mergers and acquisitions reshaping the competitive landscape. This trend concentrates market power, often leading to heightened rivalry among fewer, larger firms. The increased size of competitors can intensify price wars and service battles. For instance, in 2024, several deals have reshaped the industry.
- Mergers and acquisitions in 2024 have involved companies like Element Fleet Management and Enterprise Fleet Management.
- Consolidation can lead to increased market share concentration.
- Rivalry intensity increases as firms compete for market share.
- The top 5 fleet management companies control a significant portion of the market.
Fleet Management: A Competitive Landscape
Competitive rivalry in fleet management is fierce, with numerous players vying for market share. The top 10 firms held about 60% of the market in 2024, showing intense competition. Consolidation through mergers intensified rivalry.
| Aspect | Details | 2024 Data |
|---|---|---|
| Market Share Concentration | Top 10 companies control a significant portion | ~60% |
| Fleet Turnover Rate | Average customer mobility | ~25% |
| Market Growth | Global fleet management market | $23.17B (2023), $44.73B (2030 est.) |
MERCHANTS FLEET PORTER'S FIVE FORCES TEMPLATE RESEARCH
What is included in the product
Tailored exclusively for Merchants Fleet, analyzing its position within its competitive landscape.
Instantly see competitive intensity through clear force visualizations—perfect for strategic planning.
Full Version Awaits
Merchants Fleet Porter's Five Forces Analysis
This preview showcases the complete Porter's Five Forces analysis for Merchants Fleet. The document presented here is the exact, fully realized analysis you'll receive after your purchase. It's professionally formatted and ready for immediate application to your specific needs. The document requires no further customization or setup. This is the final, ready-to-use deliverable.
Porter's Five Forces Analysis Template
From Overview to Strategy Blueprint
Merchants Fleet faces complex competitive pressures. Buyer power is moderate due to diverse customer segments and contract options. Suppliers hold limited influence with a fragmented landscape. The threat of new entrants is low, given industry barriers. Substitute threats are manageable, but evolving. Rivalry is intense with key players vying for market share.
Our full Porter's Five Forces report goes deeper—offering a data-driven framework to understand Merchants Fleet's real business risks and market opportunities.
Suppliers Bargaining Power
Vehicle Manufacturers
Merchants Fleet, as a fleet management company, is highly dependent on vehicle manufacturers for its vehicle supply. The concentration within the automotive industry, with a few major players, gives these manufacturers considerable pricing power. Supply chain issues, like the 2021-2023 semiconductor shortage, further strengthened their position, increasing vehicle acquisition costs. For example, the average transaction price for a new vehicle in December 2023 was about $47,928, up from $46,668 in December 2022, impacting fleet costs.
Technology Providers
Technology providers offer crucial fleet management solutions, giving them bargaining power. Their specialized telematics, software, and data analytics are key. Switching costs for Merchants Fleet are a factor. The uniqueness of offerings impacts pricing and terms. In 2024, the fleet management software market is valued at approximately $19 billion.
Maintenance and Repair Services
The bargaining power of maintenance and repair service providers significantly affects Merchants Fleet. The availability of qualified technicians and parts directly influences operating costs. A scarcity of skilled labor or limited parts availability strengthens the service providers' position. For instance, in 2024, the average cost for commercial vehicle maintenance increased by 7%, impacting fleet operations. This increase underscores the importance of managing these supplier relationships.
Fuel and Energy Providers
Fuel and energy providers wield significant bargaining power, influencing Merchants Fleet's operational costs. Price volatility in gasoline and diesel, alongside the rollout of EV charging infrastructure, directly impacts expenses. For instance, in 2024, the average price of regular gasoline fluctuated, affecting fleet budgets. The shift to EVs introduces dependence on electricity providers, adding another layer of cost consideration.
- Fuel prices rose in early 2024, peaking in the summer before easing slightly.
- EV charging infrastructure expansion varies regionally, impacting operational efficiency.
- Electricity costs for EVs present a new variable in fleet budgeting.
- Alternative fuel options add complexity to supply chain management.
Financing and Capital Providers
For Merchants Fleet, the bargaining power of financing and capital providers significantly impacts operations. Access to favorable financing terms from banks and financial institutions directly affects the cost of acquiring and maintaining its vehicle fleet. In 2024, interest rates and credit availability will be key factors influencing Merchants Fleet's profitability and expansion strategies. The company must manage its relationships with lenders to secure competitive funding rates.
- Interest rate hikes in 2023-2024 have increased borrowing costs.
- Access to capital determines fleet growth pace.
- Financial stability of providers matters.
- Merchants Fleet needs diverse funding sources.
Fleet Costs: A Multi-Supplier Challenge
Merchants Fleet faces supplier power from multiple fronts. Vehicle manufacturers' pricing power is significant due to industry concentration. Technology providers’ specialized solutions also influence pricing. Maintenance, fuel, and financing providers further impact costs.
| Supplier Type | Impact | 2024 Data |
|---|---|---|
| Vehicle Manufacturers | High pricing power | Avg. new vehicle price: ~$47,928 (Dec 2023) |
| Technology Providers | Influences pricing | Fleet software market: ~$19B |
| Maintenance/Repair | Affects operating costs | Commercial vehicle maintenance cost increase: 7% |
| Fuel/Energy | Impacts expenses | Gasoline prices fluctuated |
| Financing | Affects fleet costs | Interest rates increased |
Customers Bargaining Power
Large Fleet Operators
Large fleet operators wield considerable bargaining power because of the substantial business volume they control. These customers, representing significant revenue streams, can push for advantageous pricing, service customizations, and contract terms. For example, in 2024, fleet operators managing over 1,000 vehicles secured discounts averaging 7% on new vehicle purchases. Their negotiating leverage stems from the ability to shift substantial orders, affecting a vendor's market share. Consequently, vendors often concede to maintain these crucial, high-volume accounts.
Diverse Customer Base
Merchants Fleet's diverse customer base, encompassing businesses and government entities, reduces customer bargaining power. This distribution across various industries prevents any single customer segment from heavily influencing pricing or terms. For example, in 2024, no single customer accounted for more than 10% of revenue, showing a balanced customer portfolio.
Availability of Alternatives
Customers of Merchants Fleet have considerable bargaining power due to the availability of alternatives. They can choose from various fleet management providers, or opt for in-house fleet management. The ease of switching to competitors, like Enterprise Fleet Management, significantly boosts customer leverage. In 2024, the fleet management market was estimated at over $30 billion, highlighting numerous options.
Price Sensitivity
Customers, particularly those with extensive vehicle fleets, are notably price-conscious. Their primary goal is to cut operational expenses, which gives them considerable bargaining power. This emphasis on cost-effectiveness allows them to drive favorable pricing terms. In 2024, the average fleet operating cost was around $0.80 per mile, making price a critical factor.
- Fleet managers often negotiate aggressively to lower per-vehicle costs.
- Cost-saving solutions are actively sought to reduce expenditures.
- Price sensitivity impacts vendor selection in the fleet industry.
- Large fleet operators can demand discounts due to volume.
Industry-Specific Needs
Different industries have distinct fleet demands. Customers in last-mile delivery or transitioning to electric vehicles (EVs) may wield more bargaining power. This is due to the specialized nature of their needs. The availability of providers meeting these unique requirements varies. Consider that in 2024, EV fleet adoption grew by 35% across various sectors.
- Last-mile delivery companies often seek specific vehicle configurations.
- EV adoption rates influence customer bargaining power.
- Specialized needs increase customer leverage.
- Provider availability impacts negotiating strength.
Fleet Management Dynamics: Bargaining Power & Market Size
Customer bargaining power at Merchants Fleet varies, with large fleet operators having more leverage due to volume. They negotiate better terms, impacting pricing and service. The fleet management market, valued at over $30B in 2024, offers customers diverse choices.
| Factor | Impact | 2024 Data |
|---|---|---|
| Fleet Size | Higher bargaining power | 7% discount for fleets >1,000 vehicles |
| Market Competition | Increased leverage | $30B+ fleet management market |
| Cost Focus | Stronger negotiation | Avg. operating cost ~$0.80/mile |
Rivalry Among Competitors
Number and Diversity of Competitors
The fleet management market features numerous competitors, from giants like Enterprise Fleet Management to smaller regional players. This wide range of competitors leads to intense rivalry. In 2024, the top 10 fleet management companies controlled about 60% of the market share, indicating significant competition. This fragmentation ensures that no single company can dominate, fostering a battle for market share and customer acquisition.
Market Growth Rate
The fleet management market is booming, fueled by e-commerce and tech adoption. This growth, though positive, intensifies the battle for market share. The global fleet management market was valued at $23.17 billion in 2023. It is expected to reach $44.73 billion by 2030. This expansion creates both opportunities and fierce competition.
Differentiation of Services
Fleet management companies vie for market share by offering diverse services like leasing, maintenance, and telematics. Merchants Fleet's ability to stand out hinges on its service differentiation, especially in electric vehicle (EV) solutions and tech. In 2024, the EV fleet market expanded, with Merchants Fleet strategically positioning itself. Merchants Fleet's investments in technology are key to its competitive edge.
Switching Costs for Customers
Switching costs for customers in the fleet management industry are present, but not always a major barrier. While customers can switch providers, doing so might mean dealing with contract terms or data migration. Lower switching costs can increase rivalry as customers have a simple path to move to another option. According to a 2024 report by the Automotive Fleet, the average fleet turnover rate is about 25%, indicating a moderate level of customer mobility.
- Contractual obligations might lock customers into a specific provider.
- Data migration can be complicated, causing downtime or data loss.
- Some providers offer incentives to reduce switching costs.
- The level of customer satisfaction can affect the decision to switch.
Industry Consolidation
The fleet management sector has experienced consolidation, with mergers and acquisitions reshaping the competitive landscape. This trend concentrates market power, often leading to heightened rivalry among fewer, larger firms. The increased size of competitors can intensify price wars and service battles. For instance, in 2024, several deals have reshaped the industry.
- Mergers and acquisitions in 2024 have involved companies like Element Fleet Management and Enterprise Fleet Management.
- Consolidation can lead to increased market share concentration.
- Rivalry intensity increases as firms compete for market share.
- The top 5 fleet management companies control a significant portion of the market.
Fleet Management: A Competitive Landscape
Competitive rivalry in fleet management is fierce, with numerous players vying for market share. The top 10 firms held about 60% of the market in 2024, showing intense competition. Consolidation through mergers intensified rivalry.
| Aspect | Details | 2024 Data |
|---|---|---|
| Market Share Concentration | Top 10 companies control a significant portion | ~60% |
| Fleet Turnover Rate | Average customer mobility | ~25% |
| Market Growth | Global fleet management market | $23.17B (2023), $44.73B (2030 est.) |
Product Information
Product Information
Shipping & Returns
Shipping & Returns
Description
What is included in the product
Tailored exclusively for Merchants Fleet, analyzing its position within its competitive landscape.
Instantly see competitive intensity through clear force visualizations—perfect for strategic planning.
Full Version Awaits
Merchants Fleet Porter's Five Forces Analysis
This preview showcases the complete Porter's Five Forces analysis for Merchants Fleet. The document presented here is the exact, fully realized analysis you'll receive after your purchase. It's professionally formatted and ready for immediate application to your specific needs. The document requires no further customization or setup. This is the final, ready-to-use deliverable.
Porter's Five Forces Analysis Template
From Overview to Strategy Blueprint
Merchants Fleet faces complex competitive pressures. Buyer power is moderate due to diverse customer segments and contract options. Suppliers hold limited influence with a fragmented landscape. The threat of new entrants is low, given industry barriers. Substitute threats are manageable, but evolving. Rivalry is intense with key players vying for market share.
Our full Porter's Five Forces report goes deeper—offering a data-driven framework to understand Merchants Fleet's real business risks and market opportunities.
Suppliers Bargaining Power
Vehicle Manufacturers
Merchants Fleet, as a fleet management company, is highly dependent on vehicle manufacturers for its vehicle supply. The concentration within the automotive industry, with a few major players, gives these manufacturers considerable pricing power. Supply chain issues, like the 2021-2023 semiconductor shortage, further strengthened their position, increasing vehicle acquisition costs. For example, the average transaction price for a new vehicle in December 2023 was about $47,928, up from $46,668 in December 2022, impacting fleet costs.
Technology Providers
Technology providers offer crucial fleet management solutions, giving them bargaining power. Their specialized telematics, software, and data analytics are key. Switching costs for Merchants Fleet are a factor. The uniqueness of offerings impacts pricing and terms. In 2024, the fleet management software market is valued at approximately $19 billion.
Maintenance and Repair Services
The bargaining power of maintenance and repair service providers significantly affects Merchants Fleet. The availability of qualified technicians and parts directly influences operating costs. A scarcity of skilled labor or limited parts availability strengthens the service providers' position. For instance, in 2024, the average cost for commercial vehicle maintenance increased by 7%, impacting fleet operations. This increase underscores the importance of managing these supplier relationships.
Fuel and Energy Providers
Fuel and energy providers wield significant bargaining power, influencing Merchants Fleet's operational costs. Price volatility in gasoline and diesel, alongside the rollout of EV charging infrastructure, directly impacts expenses. For instance, in 2024, the average price of regular gasoline fluctuated, affecting fleet budgets. The shift to EVs introduces dependence on electricity providers, adding another layer of cost consideration.
- Fuel prices rose in early 2024, peaking in the summer before easing slightly.
- EV charging infrastructure expansion varies regionally, impacting operational efficiency.
- Electricity costs for EVs present a new variable in fleet budgeting.
- Alternative fuel options add complexity to supply chain management.
Financing and Capital Providers
For Merchants Fleet, the bargaining power of financing and capital providers significantly impacts operations. Access to favorable financing terms from banks and financial institutions directly affects the cost of acquiring and maintaining its vehicle fleet. In 2024, interest rates and credit availability will be key factors influencing Merchants Fleet's profitability and expansion strategies. The company must manage its relationships with lenders to secure competitive funding rates.
- Interest rate hikes in 2023-2024 have increased borrowing costs.
- Access to capital determines fleet growth pace.
- Financial stability of providers matters.
- Merchants Fleet needs diverse funding sources.
Fleet Costs: A Multi-Supplier Challenge
Merchants Fleet faces supplier power from multiple fronts. Vehicle manufacturers' pricing power is significant due to industry concentration. Technology providers’ specialized solutions also influence pricing. Maintenance, fuel, and financing providers further impact costs.
| Supplier Type | Impact | 2024 Data |
|---|---|---|
| Vehicle Manufacturers | High pricing power | Avg. new vehicle price: ~$47,928 (Dec 2023) |
| Technology Providers | Influences pricing | Fleet software market: ~$19B |
| Maintenance/Repair | Affects operating costs | Commercial vehicle maintenance cost increase: 7% |
| Fuel/Energy | Impacts expenses | Gasoline prices fluctuated |
| Financing | Affects fleet costs | Interest rates increased |
Customers Bargaining Power
Large Fleet Operators
Large fleet operators wield considerable bargaining power because of the substantial business volume they control. These customers, representing significant revenue streams, can push for advantageous pricing, service customizations, and contract terms. For example, in 2024, fleet operators managing over 1,000 vehicles secured discounts averaging 7% on new vehicle purchases. Their negotiating leverage stems from the ability to shift substantial orders, affecting a vendor's market share. Consequently, vendors often concede to maintain these crucial, high-volume accounts.
Diverse Customer Base
Merchants Fleet's diverse customer base, encompassing businesses and government entities, reduces customer bargaining power. This distribution across various industries prevents any single customer segment from heavily influencing pricing or terms. For example, in 2024, no single customer accounted for more than 10% of revenue, showing a balanced customer portfolio.
Availability of Alternatives
Customers of Merchants Fleet have considerable bargaining power due to the availability of alternatives. They can choose from various fleet management providers, or opt for in-house fleet management. The ease of switching to competitors, like Enterprise Fleet Management, significantly boosts customer leverage. In 2024, the fleet management market was estimated at over $30 billion, highlighting numerous options.
Price Sensitivity
Customers, particularly those with extensive vehicle fleets, are notably price-conscious. Their primary goal is to cut operational expenses, which gives them considerable bargaining power. This emphasis on cost-effectiveness allows them to drive favorable pricing terms. In 2024, the average fleet operating cost was around $0.80 per mile, making price a critical factor.
- Fleet managers often negotiate aggressively to lower per-vehicle costs.
- Cost-saving solutions are actively sought to reduce expenditures.
- Price sensitivity impacts vendor selection in the fleet industry.
- Large fleet operators can demand discounts due to volume.
Industry-Specific Needs
Different industries have distinct fleet demands. Customers in last-mile delivery or transitioning to electric vehicles (EVs) may wield more bargaining power. This is due to the specialized nature of their needs. The availability of providers meeting these unique requirements varies. Consider that in 2024, EV fleet adoption grew by 35% across various sectors.
- Last-mile delivery companies often seek specific vehicle configurations.
- EV adoption rates influence customer bargaining power.
- Specialized needs increase customer leverage.
- Provider availability impacts negotiating strength.
Fleet Management Dynamics: Bargaining Power & Market Size
Customer bargaining power at Merchants Fleet varies, with large fleet operators having more leverage due to volume. They negotiate better terms, impacting pricing and service. The fleet management market, valued at over $30B in 2024, offers customers diverse choices.
| Factor | Impact | 2024 Data |
|---|---|---|
| Fleet Size | Higher bargaining power | 7% discount for fleets >1,000 vehicles |
| Market Competition | Increased leverage | $30B+ fleet management market |
| Cost Focus | Stronger negotiation | Avg. operating cost ~$0.80/mile |
Rivalry Among Competitors
Number and Diversity of Competitors
The fleet management market features numerous competitors, from giants like Enterprise Fleet Management to smaller regional players. This wide range of competitors leads to intense rivalry. In 2024, the top 10 fleet management companies controlled about 60% of the market share, indicating significant competition. This fragmentation ensures that no single company can dominate, fostering a battle for market share and customer acquisition.
Market Growth Rate
The fleet management market is booming, fueled by e-commerce and tech adoption. This growth, though positive, intensifies the battle for market share. The global fleet management market was valued at $23.17 billion in 2023. It is expected to reach $44.73 billion by 2030. This expansion creates both opportunities and fierce competition.
Differentiation of Services
Fleet management companies vie for market share by offering diverse services like leasing, maintenance, and telematics. Merchants Fleet's ability to stand out hinges on its service differentiation, especially in electric vehicle (EV) solutions and tech. In 2024, the EV fleet market expanded, with Merchants Fleet strategically positioning itself. Merchants Fleet's investments in technology are key to its competitive edge.
Switching Costs for Customers
Switching costs for customers in the fleet management industry are present, but not always a major barrier. While customers can switch providers, doing so might mean dealing with contract terms or data migration. Lower switching costs can increase rivalry as customers have a simple path to move to another option. According to a 2024 report by the Automotive Fleet, the average fleet turnover rate is about 25%, indicating a moderate level of customer mobility.
- Contractual obligations might lock customers into a specific provider.
- Data migration can be complicated, causing downtime or data loss.
- Some providers offer incentives to reduce switching costs.
- The level of customer satisfaction can affect the decision to switch.
Industry Consolidation
The fleet management sector has experienced consolidation, with mergers and acquisitions reshaping the competitive landscape. This trend concentrates market power, often leading to heightened rivalry among fewer, larger firms. The increased size of competitors can intensify price wars and service battles. For instance, in 2024, several deals have reshaped the industry.
- Mergers and acquisitions in 2024 have involved companies like Element Fleet Management and Enterprise Fleet Management.
- Consolidation can lead to increased market share concentration.
- Rivalry intensity increases as firms compete for market share.
- The top 5 fleet management companies control a significant portion of the market.
Fleet Management: A Competitive Landscape
Competitive rivalry in fleet management is fierce, with numerous players vying for market share. The top 10 firms held about 60% of the market in 2024, showing intense competition. Consolidation through mergers intensified rivalry.
| Aspect | Details | 2024 Data |
|---|---|---|
| Market Share Concentration | Top 10 companies control a significant portion | ~60% |
| Fleet Turnover Rate | Average customer mobility | ~25% |
| Market Growth | Global fleet management market | $23.17B (2023), $44.73B (2030 est.) |


