NVIDIA BCG MATRIX TEMPLATE RESEARCH
Download Your Competitive Advantage
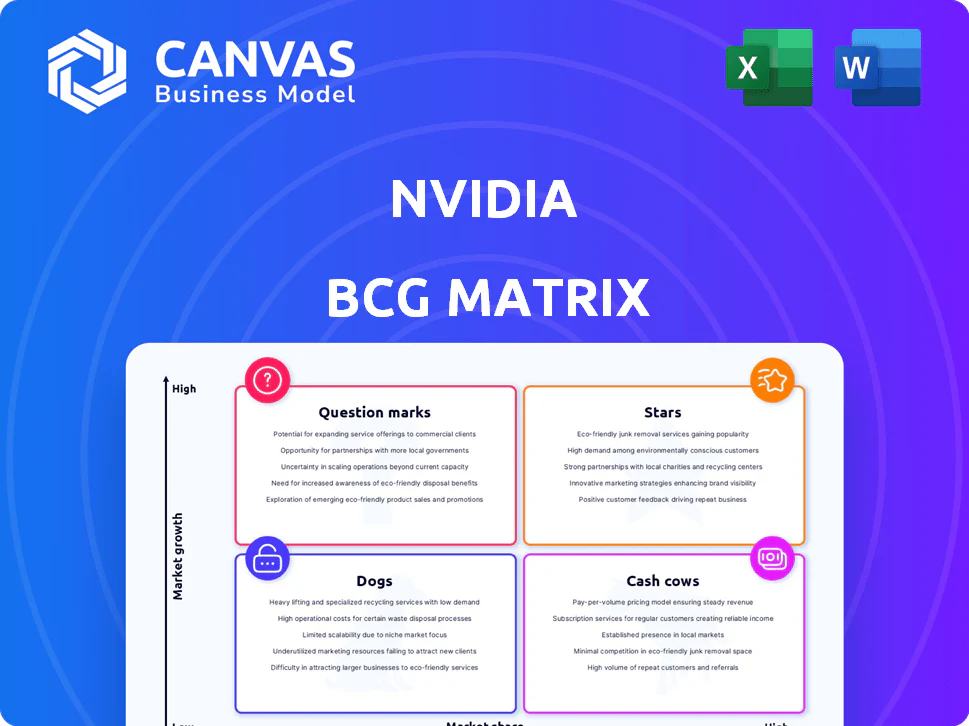
NVIDIA's BCG Matrix snapshot shows where powerhouse GPUs and data-center AI offerings likely sit as Stars, while legacy consumer lines may be slipping toward Cash Cows or Question Marks amid fierce competition; smaller peripheral products could fall into Dogs. This concise preview highlights strategic trade-offs-market growth exposure, share dynamics, and capital allocation pressures-that matter to investors and execs. Purchase the full BCG Matrix to get quadrant-by-quadrant data, actionable recommendations, and downloadable Word and Excel deliverables for immediate strategic use.
Stars
Blackwell GB200 NVL72 Systems generating over 20 billion dollars in quarterly revenue
The Blackwell GB200 NVL72 systems have become NVIDIA's Star in 2025, driving over $20 billion in quarterly revenue for NVIDIA in Q4 2025 and anchoring a data‑center ecosystem that bundles CPUs, GPUs, and advanced liquid cooling.
Demand stays extreme, with lead times >24 weeks and hyperscalers signing multi‑year supply deals covering an estimated $60-80 billion of committed capacity through 2027, reflecting high market share in a very high‑growth AI market.
AI Networking revenue exceeding a 12 billion dollar annual run rate via Spectrum-X
NVIDIA has moved from chipmaker to full-stack networking leader; Spectrum-X pushed AI Networking to a >$12.0 billion annual run rate in FY2025, driven by Ethernet for AI adoption and enterprise demand for simpler, smaller AI clusters versus InfiniBand.
Spectrum-X captured an estimated 35%-40% of modern data center networking spend in FY2025, growing faster than NVIDIA's core GPU compute in percentage terms and locking customers via hardware-level optimizations.

NVIDIA AI Enterprise software suite reaching 2 billion dollars in annualized recurring revenue
NVIDIA AI Enterprise hit $2B in annualized recurring revenue in 2025, showing the firm shift to software-led sales as the suite supplies production-grade AI plumbing.
Charging per-GPU per-year subscription yields high gross margins and scales with fleet deployments, adding recurring revenue that complements $115B 2024-25 GPU-driven hardware sales.
NIMs (NVIDIA Inference Microservices) lock in customers by embedding runtime and orchestration, raising switching costs and reducing churn risk.
It's a Star in the BCG matrix: enterprise AI adoption is in early exponential growth, keeping market share and growth both high.
Sovereign AI initiatives contributing over 10 billion dollars in fiscal 2025 revenue
NVIDIA's sovereign-AI wins drove over $10.2 billion in fiscal 2025 revenue, as governments in the Middle East, Europe, and Asia treat AI compute as national security and fund domestic data centers.
Partnering directly with states, NVIDIA supplies turnkey, national-scale stacks-giving high market share in a high-growth segment few rivals match; long-term service contracts lock in recurring revenue.
- $10.2B sovereign-AI revenue FY2025
- Contracts across 12+ countries (ME, EU, APAC)
- Average deal size $850M; multi‑year service terms
- Estimated segment CAGR 28% through 2028
Custom Silicon and AI Foundry services for hyper-scalers
NVIDIA's AI Foundry partners with hyperscalers to custom-design AI silicon, turning potential chip competition into collaboration; in FY2025 NVIDIA reported datacenter revenue of $60.7 billion, reflecting strong demand for specialized solutions.
The service licenses NVIDIA IP and R&D so customers build workload‑optimized chips; adoption is rising as the AI silicon TAM expands-IDC projects AI silicon spend to reach $200 billion by 2028.
AI Foundry is a Star: it grows fast, captures premium share, and NVIDIA competes with itself to hold market leadership in custom AI silicon.
- FY2025 datacenter rev $60.7B
- AI silicon TAM est $200B by 2028 (IDC)
- Foundry licenses NVIDIA IP, speeds time-to-market
- Competes with in-house hyperscaler chips yet expands TAM
NVIDIA's FY25 AI Dominance: $60.7B Datacenter, $12B Spectrum‑X ARR, $10.2B Sovereign
NVIDIA's Stars in FY2025: datacenter GPUs (GB200 NVL72) drove $60.7B datacenter revenue and >$20B Q4 revenue; Spectrum‑X networking hit $12B ARR with 35-40% share; NVIDIA AI Enterprise reached $2B ARR; sovereign‑AI contributed $10.2B. These businesses combine high market share and >20% CAGR in a rapidly expanding AI TAM.
| Metric | FY2025 Value |
|---|---|
| Datacenter revenue | $60.7B |
| Q4 2025 revenue (GB200) | $20B+ |
| Spectrum‑X ARR | $12.0B |
| Spectrum‑X share | 35-40% |
| NVIDIA AI Enterprise ARR | $2.0B |
| Sovereign‑AI revenue | $10.2B |
What is included in the product
BCG Matrix for NVIDIA: maps GPUs/AI as Stars, data-center platforms as Cash Cows, edge/automotive as Question Marks, legacy segments as Dogs.
One-page NVIDIA BCG Matrix placing GPUs, AI platforms, data center and automotive in clear quadrants for fast C-level decisions.
Cash Cows
GeForce RTX Gaming GPUs maintaining over 75 percent market share in a mature PC market
The GeForce RTX gaming GPUs hold over 75% share of discrete GPU gaming shipments in 2025, generating roughly $18.4B of NVIDIA's $60.9B FY2025 revenue, making gaming the cash-flow bedrock funding R&D in AI and data-center businesses.
PC market growth is mature (~1-2% CAGR); brand loyalty lets NVIDIA keep average GPU ASPs high-RTX 50-series lifted gaming GPU gross margin to ~58% in FY2025 through premium pricing and DLSS-driven ecosystem stickiness.
This Cash Cow needs less promotion versus NVIDIA's high-growth AI segments, freeing operating cash to support aggressive investment in data-center GPUs and software while sustaining steady free cash flow (~$16.2B operating cash in FY2025).
Hopper H100 and H200 GPU architecture legacy sales
Hopper H100/H200 now act as NVIDIA Cash Cows: FY2025 unit sales ~200k-250k, generating roughly $8.5-$10.5B revenue and gross margins >65% as yields improved and wafer costs fell, so these chips fund Blackwell R&D with minimal capex.

Professional Visualization and RTX Workstation sales for industrial design
NVIDIA's RTX and professional-visualization workstation business serves architects, engineers and digital creators with certified hardware/drivers, holding >90% share in high-end professional graphics and generating roughly $3.8 billion in 2025 revenue from Professional Visualization and Workstation-related sales.
Margins stay high-operating margins near 40% for this segment-delivering steady, predictable cash flow tied to corporate refresh cycles rather than AI-driven spikes.
The unit's modest CAGR (~4% over 2022-2025) makes it a cash cow that funds R&D and capital allocation, contributing reliable liquidity to NVIDIA's broader strategic initiatives.
Automotive Infotainment and legacy SoC contracts
vGPU and Grid software licensing for virtual desktops
NVIDIA's vGPU and GRID licensing lets many users share one physical GPU-standard in enterprise VDI-and generated roughly $1.2B in software revenue in FY2025, reflecting steady, recurring fees.
The market is mature with limited rivals for high-performance graphics virtualization, so margins stay high and growth is slow; maintenance needs are low, making it a textbook cash cow.
- vGPU share: enterprise adoption >40% of leading VDI deployments (2025)
- FY2025 NVIDIA software revenue: ~$1.2B
- High gross margins, low incremental capex
- Slow market CAGR: mid-single digits
NVIDIA FY2025: RTX $18.4B drives profits; H100/H200 and software fuel margin strength
GeForce RTX gaming: $18.4B of NVIDIA's $60.9B FY2025 revenue, >75% discrete share, ~58% gross margin; Data‑center Hopper H100/H200: $8.5-$10.5B, >65% gross margin; Professional visualization: $3.8B, ~40% operating margin; Automotive: $1.04B (FY2025, +8% YoY); vGPU software: $1.2B.
| Segment | FY2025 Revenue | Key metric |
|---|---|---|
| GeForce RTX | $18.4B | ~58% gross margin |
| H100/H200 | $8.5-$10.5B | >65% gross margin |
| Pro Visualization | $3.8B | ~40% operating margin |
| Automotive | $1.04B | +8% YoY |
| vGPU Software | $1.2B | recurring, high margin |
Preview = Final Product
NVIDIA BCG Matrix
The file you're previewing on this page is the final NVIDIA BCG Matrix report you'll receive after purchase; no watermarks, no demo content-just a fully formatted, analysis-ready document built for strategic clarity and professional presentation.

Original: $10.00
-65%$10.00
$3.50NVIDIA BCG MATRIX TEMPLATE RESEARCH
Download Your Competitive Advantage
NVIDIA's BCG Matrix snapshot shows where powerhouse GPUs and data-center AI offerings likely sit as Stars, while legacy consumer lines may be slipping toward Cash Cows or Question Marks amid fierce competition; smaller peripheral products could fall into Dogs. This concise preview highlights strategic trade-offs-market growth exposure, share dynamics, and capital allocation pressures-that matter to investors and execs. Purchase the full BCG Matrix to get quadrant-by-quadrant data, actionable recommendations, and downloadable Word and Excel deliverables for immediate strategic use.
Stars
Blackwell GB200 NVL72 Systems generating over 20 billion dollars in quarterly revenue
The Blackwell GB200 NVL72 systems have become NVIDIA's Star in 2025, driving over $20 billion in quarterly revenue for NVIDIA in Q4 2025 and anchoring a data‑center ecosystem that bundles CPUs, GPUs, and advanced liquid cooling.
Demand stays extreme, with lead times >24 weeks and hyperscalers signing multi‑year supply deals covering an estimated $60-80 billion of committed capacity through 2027, reflecting high market share in a very high‑growth AI market.
AI Networking revenue exceeding a 12 billion dollar annual run rate via Spectrum-X
NVIDIA has moved from chipmaker to full-stack networking leader; Spectrum-X pushed AI Networking to a >$12.0 billion annual run rate in FY2025, driven by Ethernet for AI adoption and enterprise demand for simpler, smaller AI clusters versus InfiniBand.
Spectrum-X captured an estimated 35%-40% of modern data center networking spend in FY2025, growing faster than NVIDIA's core GPU compute in percentage terms and locking customers via hardware-level optimizations.
NVIDIA AI Enterprise software suite reaching 2 billion dollars in annualized recurring revenue
NVIDIA AI Enterprise hit $2B in annualized recurring revenue in 2025, showing the firm shift to software-led sales as the suite supplies production-grade AI plumbing.
Charging per-GPU per-year subscription yields high gross margins and scales with fleet deployments, adding recurring revenue that complements $115B 2024-25 GPU-driven hardware sales.
NIMs (NVIDIA Inference Microservices) lock in customers by embedding runtime and orchestration, raising switching costs and reducing churn risk.
It's a Star in the BCG matrix: enterprise AI adoption is in early exponential growth, keeping market share and growth both high.
Sovereign AI initiatives contributing over 10 billion dollars in fiscal 2025 revenue
NVIDIA's sovereign-AI wins drove over $10.2 billion in fiscal 2025 revenue, as governments in the Middle East, Europe, and Asia treat AI compute as national security and fund domestic data centers.
Partnering directly with states, NVIDIA supplies turnkey, national-scale stacks-giving high market share in a high-growth segment few rivals match; long-term service contracts lock in recurring revenue.
- $10.2B sovereign-AI revenue FY2025
- Contracts across 12+ countries (ME, EU, APAC)
- Average deal size $850M; multi‑year service terms
- Estimated segment CAGR 28% through 2028
Custom Silicon and AI Foundry services for hyper-scalers
NVIDIA's AI Foundry partners with hyperscalers to custom-design AI silicon, turning potential chip competition into collaboration; in FY2025 NVIDIA reported datacenter revenue of $60.7 billion, reflecting strong demand for specialized solutions.
The service licenses NVIDIA IP and R&D so customers build workload‑optimized chips; adoption is rising as the AI silicon TAM expands-IDC projects AI silicon spend to reach $200 billion by 2028.
AI Foundry is a Star: it grows fast, captures premium share, and NVIDIA competes with itself to hold market leadership in custom AI silicon.
- FY2025 datacenter rev $60.7B
- AI silicon TAM est $200B by 2028 (IDC)
- Foundry licenses NVIDIA IP, speeds time-to-market
- Competes with in-house hyperscaler chips yet expands TAM
NVIDIA's FY25 AI Dominance: $60.7B Datacenter, $12B Spectrum‑X ARR, $10.2B Sovereign
NVIDIA's Stars in FY2025: datacenter GPUs (GB200 NVL72) drove $60.7B datacenter revenue and >$20B Q4 revenue; Spectrum‑X networking hit $12B ARR with 35-40% share; NVIDIA AI Enterprise reached $2B ARR; sovereign‑AI contributed $10.2B. These businesses combine high market share and >20% CAGR in a rapidly expanding AI TAM.
| Metric | FY2025 Value |
|---|---|
| Datacenter revenue | $60.7B |
| Q4 2025 revenue (GB200) | $20B+ |
| Spectrum‑X ARR | $12.0B |
| Spectrum‑X share | 35-40% |
| NVIDIA AI Enterprise ARR | $2.0B |
| Sovereign‑AI revenue | $10.2B |
What is included in the product
BCG Matrix for NVIDIA: maps GPUs/AI as Stars, data-center platforms as Cash Cows, edge/automotive as Question Marks, legacy segments as Dogs.
One-page NVIDIA BCG Matrix placing GPUs, AI platforms, data center and automotive in clear quadrants for fast C-level decisions.
Cash Cows
GeForce RTX Gaming GPUs maintaining over 75 percent market share in a mature PC market
The GeForce RTX gaming GPUs hold over 75% share of discrete GPU gaming shipments in 2025, generating roughly $18.4B of NVIDIA's $60.9B FY2025 revenue, making gaming the cash-flow bedrock funding R&D in AI and data-center businesses.
PC market growth is mature (~1-2% CAGR); brand loyalty lets NVIDIA keep average GPU ASPs high-RTX 50-series lifted gaming GPU gross margin to ~58% in FY2025 through premium pricing and DLSS-driven ecosystem stickiness.
This Cash Cow needs less promotion versus NVIDIA's high-growth AI segments, freeing operating cash to support aggressive investment in data-center GPUs and software while sustaining steady free cash flow (~$16.2B operating cash in FY2025).
Hopper H100 and H200 GPU architecture legacy sales
Hopper H100/H200 now act as NVIDIA Cash Cows: FY2025 unit sales ~200k-250k, generating roughly $8.5-$10.5B revenue and gross margins >65% as yields improved and wafer costs fell, so these chips fund Blackwell R&D with minimal capex.
Professional Visualization and RTX Workstation sales for industrial design
NVIDIA's RTX and professional-visualization workstation business serves architects, engineers and digital creators with certified hardware/drivers, holding >90% share in high-end professional graphics and generating roughly $3.8 billion in 2025 revenue from Professional Visualization and Workstation-related sales.
Margins stay high-operating margins near 40% for this segment-delivering steady, predictable cash flow tied to corporate refresh cycles rather than AI-driven spikes.
The unit's modest CAGR (~4% over 2022-2025) makes it a cash cow that funds R&D and capital allocation, contributing reliable liquidity to NVIDIA's broader strategic initiatives.
Automotive Infotainment and legacy SoC contracts
vGPU and Grid software licensing for virtual desktops
NVIDIA's vGPU and GRID licensing lets many users share one physical GPU-standard in enterprise VDI-and generated roughly $1.2B in software revenue in FY2025, reflecting steady, recurring fees.
The market is mature with limited rivals for high-performance graphics virtualization, so margins stay high and growth is slow; maintenance needs are low, making it a textbook cash cow.
- vGPU share: enterprise adoption >40% of leading VDI deployments (2025)
- FY2025 NVIDIA software revenue: ~$1.2B
- High gross margins, low incremental capex
- Slow market CAGR: mid-single digits
NVIDIA FY2025: RTX $18.4B drives profits; H100/H200 and software fuel margin strength
GeForce RTX gaming: $18.4B of NVIDIA's $60.9B FY2025 revenue, >75% discrete share, ~58% gross margin; Data‑center Hopper H100/H200: $8.5-$10.5B, >65% gross margin; Professional visualization: $3.8B, ~40% operating margin; Automotive: $1.04B (FY2025, +8% YoY); vGPU software: $1.2B.
| Segment | FY2025 Revenue | Key metric |
|---|---|---|
| GeForce RTX | $18.4B | ~58% gross margin |
| H100/H200 | $8.5-$10.5B | >65% gross margin |
| Pro Visualization | $3.8B | ~40% operating margin |
| Automotive | $1.04B | +8% YoY |
| vGPU Software | $1.2B | recurring, high margin |
Preview = Final Product
NVIDIA BCG Matrix
The file you're previewing on this page is the final NVIDIA BCG Matrix report you'll receive after purchase; no watermarks, no demo content-just a fully formatted, analysis-ready document built for strategic clarity and professional presentation.
Product Information
Product Information
Shipping & Returns
Shipping & Returns
Description
Download Your Competitive Advantage
NVIDIA's BCG Matrix snapshot shows where powerhouse GPUs and data-center AI offerings likely sit as Stars, while legacy consumer lines may be slipping toward Cash Cows or Question Marks amid fierce competition; smaller peripheral products could fall into Dogs. This concise preview highlights strategic trade-offs-market growth exposure, share dynamics, and capital allocation pressures-that matter to investors and execs. Purchase the full BCG Matrix to get quadrant-by-quadrant data, actionable recommendations, and downloadable Word and Excel deliverables for immediate strategic use.
Stars
Blackwell GB200 NVL72 Systems generating over 20 billion dollars in quarterly revenue
The Blackwell GB200 NVL72 systems have become NVIDIA's Star in 2025, driving over $20 billion in quarterly revenue for NVIDIA in Q4 2025 and anchoring a data‑center ecosystem that bundles CPUs, GPUs, and advanced liquid cooling.
Demand stays extreme, with lead times >24 weeks and hyperscalers signing multi‑year supply deals covering an estimated $60-80 billion of committed capacity through 2027, reflecting high market share in a very high‑growth AI market.
AI Networking revenue exceeding a 12 billion dollar annual run rate via Spectrum-X
NVIDIA has moved from chipmaker to full-stack networking leader; Spectrum-X pushed AI Networking to a >$12.0 billion annual run rate in FY2025, driven by Ethernet for AI adoption and enterprise demand for simpler, smaller AI clusters versus InfiniBand.
Spectrum-X captured an estimated 35%-40% of modern data center networking spend in FY2025, growing faster than NVIDIA's core GPU compute in percentage terms and locking customers via hardware-level optimizations.
NVIDIA AI Enterprise software suite reaching 2 billion dollars in annualized recurring revenue
NVIDIA AI Enterprise hit $2B in annualized recurring revenue in 2025, showing the firm shift to software-led sales as the suite supplies production-grade AI plumbing.
Charging per-GPU per-year subscription yields high gross margins and scales with fleet deployments, adding recurring revenue that complements $115B 2024-25 GPU-driven hardware sales.
NIMs (NVIDIA Inference Microservices) lock in customers by embedding runtime and orchestration, raising switching costs and reducing churn risk.
It's a Star in the BCG matrix: enterprise AI adoption is in early exponential growth, keeping market share and growth both high.
Sovereign AI initiatives contributing over 10 billion dollars in fiscal 2025 revenue
NVIDIA's sovereign-AI wins drove over $10.2 billion in fiscal 2025 revenue, as governments in the Middle East, Europe, and Asia treat AI compute as national security and fund domestic data centers.
Partnering directly with states, NVIDIA supplies turnkey, national-scale stacks-giving high market share in a high-growth segment few rivals match; long-term service contracts lock in recurring revenue.
- $10.2B sovereign-AI revenue FY2025
- Contracts across 12+ countries (ME, EU, APAC)
- Average deal size $850M; multi‑year service terms
- Estimated segment CAGR 28% through 2028
Custom Silicon and AI Foundry services for hyper-scalers
NVIDIA's AI Foundry partners with hyperscalers to custom-design AI silicon, turning potential chip competition into collaboration; in FY2025 NVIDIA reported datacenter revenue of $60.7 billion, reflecting strong demand for specialized solutions.
The service licenses NVIDIA IP and R&D so customers build workload‑optimized chips; adoption is rising as the AI silicon TAM expands-IDC projects AI silicon spend to reach $200 billion by 2028.
AI Foundry is a Star: it grows fast, captures premium share, and NVIDIA competes with itself to hold market leadership in custom AI silicon.
- FY2025 datacenter rev $60.7B
- AI silicon TAM est $200B by 2028 (IDC)
- Foundry licenses NVIDIA IP, speeds time-to-market
- Competes with in-house hyperscaler chips yet expands TAM
NVIDIA's FY25 AI Dominance: $60.7B Datacenter, $12B Spectrum‑X ARR, $10.2B Sovereign
NVIDIA's Stars in FY2025: datacenter GPUs (GB200 NVL72) drove $60.7B datacenter revenue and >$20B Q4 revenue; Spectrum‑X networking hit $12B ARR with 35-40% share; NVIDIA AI Enterprise reached $2B ARR; sovereign‑AI contributed $10.2B. These businesses combine high market share and >20% CAGR in a rapidly expanding AI TAM.
| Metric | FY2025 Value |
|---|---|
| Datacenter revenue | $60.7B |
| Q4 2025 revenue (GB200) | $20B+ |
| Spectrum‑X ARR | $12.0B |
| Spectrum‑X share | 35-40% |
| NVIDIA AI Enterprise ARR | $2.0B |
| Sovereign‑AI revenue | $10.2B |
What is included in the product
BCG Matrix for NVIDIA: maps GPUs/AI as Stars, data-center platforms as Cash Cows, edge/automotive as Question Marks, legacy segments as Dogs.
One-page NVIDIA BCG Matrix placing GPUs, AI platforms, data center and automotive in clear quadrants for fast C-level decisions.
Cash Cows
GeForce RTX Gaming GPUs maintaining over 75 percent market share in a mature PC market
The GeForce RTX gaming GPUs hold over 75% share of discrete GPU gaming shipments in 2025, generating roughly $18.4B of NVIDIA's $60.9B FY2025 revenue, making gaming the cash-flow bedrock funding R&D in AI and data-center businesses.
PC market growth is mature (~1-2% CAGR); brand loyalty lets NVIDIA keep average GPU ASPs high-RTX 50-series lifted gaming GPU gross margin to ~58% in FY2025 through premium pricing and DLSS-driven ecosystem stickiness.
This Cash Cow needs less promotion versus NVIDIA's high-growth AI segments, freeing operating cash to support aggressive investment in data-center GPUs and software while sustaining steady free cash flow (~$16.2B operating cash in FY2025).
Hopper H100 and H200 GPU architecture legacy sales
Hopper H100/H200 now act as NVIDIA Cash Cows: FY2025 unit sales ~200k-250k, generating roughly $8.5-$10.5B revenue and gross margins >65% as yields improved and wafer costs fell, so these chips fund Blackwell R&D with minimal capex.
Professional Visualization and RTX Workstation sales for industrial design
NVIDIA's RTX and professional-visualization workstation business serves architects, engineers and digital creators with certified hardware/drivers, holding >90% share in high-end professional graphics and generating roughly $3.8 billion in 2025 revenue from Professional Visualization and Workstation-related sales.
Margins stay high-operating margins near 40% for this segment-delivering steady, predictable cash flow tied to corporate refresh cycles rather than AI-driven spikes.
The unit's modest CAGR (~4% over 2022-2025) makes it a cash cow that funds R&D and capital allocation, contributing reliable liquidity to NVIDIA's broader strategic initiatives.
Automotive Infotainment and legacy SoC contracts
vGPU and Grid software licensing for virtual desktops
NVIDIA's vGPU and GRID licensing lets many users share one physical GPU-standard in enterprise VDI-and generated roughly $1.2B in software revenue in FY2025, reflecting steady, recurring fees.
The market is mature with limited rivals for high-performance graphics virtualization, so margins stay high and growth is slow; maintenance needs are low, making it a textbook cash cow.
- vGPU share: enterprise adoption >40% of leading VDI deployments (2025)
- FY2025 NVIDIA software revenue: ~$1.2B
- High gross margins, low incremental capex
- Slow market CAGR: mid-single digits
NVIDIA FY2025: RTX $18.4B drives profits; H100/H200 and software fuel margin strength
GeForce RTX gaming: $18.4B of NVIDIA's $60.9B FY2025 revenue, >75% discrete share, ~58% gross margin; Data‑center Hopper H100/H200: $8.5-$10.5B, >65% gross margin; Professional visualization: $3.8B, ~40% operating margin; Automotive: $1.04B (FY2025, +8% YoY); vGPU software: $1.2B.
| Segment | FY2025 Revenue | Key metric |
|---|---|---|
| GeForce RTX | $18.4B | ~58% gross margin |
| H100/H200 | $8.5-$10.5B | >65% gross margin |
| Pro Visualization | $3.8B | ~40% operating margin |
| Automotive | $1.04B | +8% YoY |
| vGPU Software | $1.2B | recurring, high margin |
Preview = Final Product
NVIDIA BCG Matrix
The file you're previewing on this page is the final NVIDIA BCG Matrix report you'll receive after purchase; no watermarks, no demo content-just a fully formatted, analysis-ready document built for strategic clarity and professional presentation.


