#PAID PORTER'S FIVE FORCES TEMPLATE RESEARCH
What is included in the product
Tailored exclusively for #Paid, analyzing its position within its competitive landscape.
Customize pressure levels based on new data and evolving market trends.
Preview the Actual Deliverable
#Paid Porter's Five Forces Analysis
This preview showcases the exact #Paid Porter's Five Forces analysis you'll receive after purchase—a comprehensive, ready-to-use document.

Porter's Five Forces Analysis Template
From Overview to Strategy Blueprint
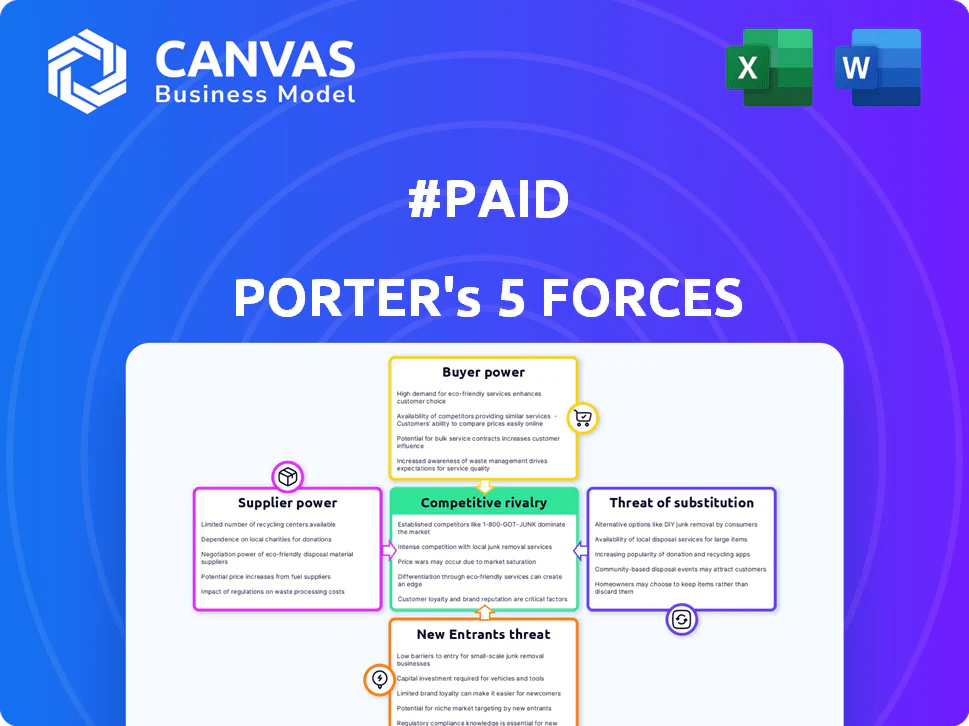
Understanding #Paid's competitive landscape is vital. This analysis briefly examines the forces shaping its market position, including the intensity of rivalry, bargaining power of buyers, and the threat of new entrants. We've also touched on the influence of suppliers and the availability of substitutes. This brief snapshot only scratches the surface. Unlock the full Porter's Five Forces Analysis to explore #Paid’s competitive dynamics, market pressures, and strategic advantages in detail.
Suppliers Bargaining Power
Concentration of Creators
The concentration of creators on major platforms like Instagram, TikTok, and YouTube gives these platforms substantial power as suppliers of audience reach. In 2024, Instagram's ad revenue alone is projected to be over $60 billion. #Paid depends on these platforms and their APIs to manage campaigns. The top 1% of creators often command the majority of brand budgets.
Uniqueness of Creator Content
Creators with unique content or engaged audiences have strong bargaining power. This allows them to negotiate better rates and terms with platforms and brands. In 2024, the top 1% of creators earned significantly more. This shift is due to the high demand for their specialized content. They can leverage their uniqueness to secure favorable deals.

Cost of Switching for Creators
Creators often find it easy to switch between platforms or agencies, boosting their bargaining power. This flexibility lets creators seek better deals if dissatisfied. In 2024, the creator economy saw over $250 billion in market size, making platforms compete for talent. This competition boosts creators' leverage, allowing them to negotiate better terms.
Availability of Alternative Platforms for Creators
Creators aren't locked into #Paid; they can use various influencer marketing platforms and agencies to find brand deals. This competition gives creators leverage, allowing them to negotiate better rates and terms. For example, the influencer marketing industry is projected to reach $22.2 billion in 2024, with over 75% of marketers planning to use influencer marketing, showing the wide range of options. This landscape shifts the power balance.
- Market Growth: The influencer marketing industry's expansion provides creators with more choices.
- Platform Proliferation: A multitude of platforms and agencies offer creators diverse opportunities.
- Negotiating Power: Increased competition benefits creators in negotiating terms.
- Industry Investment: Marketers' continued investment in influencer marketing supports creator independence.
Forward Integration Threat from Creators
Highly successful creators or creator networks could indeed pose a threat to platforms like #Paid by integrating forward. This means they might establish direct brand relationships, reducing reliance on intermediaries. For instance, some top YouTubers have already started their own influencer marketing agencies, cutting out the middleman. This shift gives these creators more control and leverage.
- Forward integration allows creators to capture a larger share of the revenue from brand partnerships.
- Successful creators gain the ability to set their own rates and negotiate directly with brands.
- This strategy could lead to a decline in the market share for platforms like #Paid if creators opt to go direct.
- The trend highlights the evolving power dynamics in the creator economy, where creators are increasingly acting as businesses.
Creators' Power Surge: $22.2B Market & Leverage
Creators wield strong bargaining power due to platform concentration and content uniqueness. In 2024, influencer marketing hit $22.2B, boosting creator leverage. Their ability to switch platforms enhances negotiation capabilities.
| Aspect | Impact | Data (2024) |
|---|---|---|
| Market Growth | More Choices | $22.2B Influencer Market |
| Platform Proliferation | Diverse Opportunities | 75% Marketers use Influencer Marketing |
| Negotiating Power | Better Terms | Top 1% Creators Earn More |
Customers Bargaining Power
Concentration of Brands
If #Paid relies heavily on a few major clients for revenue, those clients gain strong bargaining power. In 2024, a firm with 70% revenue from top 5 clients might face intense price pressure. This concentration enables clients to demand discounts or better service terms. This can significantly impact #Paid's profitability and margins.
Availability of Alternative Marketing Channels
Brands wield significant bargaining power due to diverse marketing channels. In 2024, digital ad spending hit $300 billion. This includes options like TV, print, and paid search. This availability allows brands to negotiate better rates and terms with #Paid or explore more cost-effective alternatives.

Cost of Switching for Brands
Switching costs for brands in influencer marketing can fluctuate. Low switching costs empower brands to negotiate better terms with platforms like #Paid. According to a 2024 study, 60% of brands switch platforms within a year to optimize costs. This gives brands significant leverage.
Price Sensitivity of Brands
Brands, particularly those with restricted marketing funds, are notably price-conscious and may readily shift to rivals if #Paid's pricing isn't competitive. The digital marketing sector, valued at approximately $785.1 billion in 2023, shows intense competition, pushing brands to seek cost-effective solutions. Small and medium-sized businesses (SMBs), which make up a significant portion of #Paid's customer base, often have tight budgets, making price a critical factor in their decisions. Data from 2024 indicates that about 60% of SMBs consider pricing as their primary factor in choosing marketing services.
- Marketing Budget Constraints
- Competitive Pricing Pressure
- SMB Price Sensitivity
- Alternative Marketing Options
Backward Integration Threat from Brands
Large brands, armed with substantial resources, might choose to create their own influencer marketing teams and platforms. This move reduces their dependence on external providers like #Paid, boosting their bargaining power. The shift towards in-house solutions could lead to a decrease in demand for external influencer marketing services. In 2024, the influencer marketing industry is projected to reach $21.1 billion, yet this figure could be impacted by backward integration. This threat strengthens brands' negotiating positions.
- Backward integration allows brands to control costs.
- It enhances control over marketing strategies.
- This strategy could reduce the need for external agencies.
- Brands gain more power in negotiations.
Customer Bargaining Power: Key Financial Impacts
Customer bargaining power significantly impacts #Paid's financial outcomes. Key factors include client concentration, with concentrated revenue streams increasing price sensitivity. Brands' access to alternative marketing channels, like digital ads, empowers them to negotiate terms. Moreover, low switching costs allow brands to easily explore competitive options.
| Factor | Impact | 2024 Data Point |
|---|---|---|
| Client Concentration | Higher bargaining power | 70% revenue from top 5 clients |
| Alternative Marketing | Increased negotiation power | Digital ad spend: $300B |
| Switching Costs | Enhanced brand leverage | 60% brands switch platforms annually |
Rivalry Among Competitors
Number and Diversity of Competitors
The influencer marketing landscape is highly competitive. In 2024, the market included numerous players, from tech giants to specialized agencies. This variety and the sheer number of competitors drive intense rivalry, making it harder for any single platform to dominate. The market's value was estimated at $21.1 billion in 2023, showing its significance.
Industry Growth Rate
The influencer marketing industry's growth rate is high, with projections indicating continued expansion. Although growth can ease rivalry, the fast pace also pulls in new competitors. For instance, the global influencer market was valued at $21.1 billion in 2023. This influx of new players sustains a competitive landscape.

Differentiation Among Platforms
The ability of #Paid to distinguish itself from rivals significantly shapes competitive intensity. Offering unique features, such as its influencer marketing platform, gives it an edge. Superior customer service and niche specialization also lessen direct competition. For instance, in 2024, companies focusing on distinct influencer segments saw higher growth rates.
Switching Costs for Customers (Brands)
Low switching costs intensify competition as brands can easily shift. This often leads to price wars and innovation races. For example, the average customer churn rate in the SaaS industry was around 10-15% in 2024. Competitive rivalry escalates when retaining customers is a constant battle. This impacts profitability and market share.
- High churn rates signify easy brand switching.
- Price wars erode profit margins.
- Innovation becomes a key differentiator.
- Market share volatility increases.
Market Share Concentration
Market share concentration significantly shapes competitive rivalry within an industry. When a few major firms control most of the market, the rivalry among them can be more strategic, focusing on product differentiation and brand building. However, smaller players often face intense competition as they struggle to gain or maintain market share. For instance, in the U.S. airline industry, the top four airlines control over 70% of the market.
- High Concentration: Fewer competitors, potentially less intense rivalry among leaders.
- Low Concentration: Many competitors, often leading to intense rivalry.
- Market leaders often focus on brand building and differentiation.
- Smaller players compete fiercely for market share.
Influencer Marketing: Fierce Competition Ahead!
Competitive rivalry in influencer marketing is intense, driven by numerous players and rapid market growth. Low switching costs and high churn rates exacerbate competition, leading to price wars and innovation races. Market share concentration also shapes rivalry; fewer dominant firms might see strategic competition, while many smaller players battle fiercely.
| Factor | Impact | Example (2024 Data) |
|---|---|---|
| Market Growth | Attracts new entrants, increasing competition. | Influencer market valued at $21.1B in 2023, growing rapidly. |
| Switching Costs | Low costs intensify rivalry. | SaaS churn rates ~10-15%. |
| Market Concentration | Influences competitive strategy. | Top 4 US airlines control over 70% market share. |
#PAID PORTER'S FIVE FORCES TEMPLATE RESEARCH
What is included in the product
Tailored exclusively for #Paid, analyzing its position within its competitive landscape.
Customize pressure levels based on new data and evolving market trends.
Preview the Actual Deliverable
#Paid Porter's Five Forces Analysis
This preview showcases the exact #Paid Porter's Five Forces analysis you'll receive after purchase—a comprehensive, ready-to-use document.
Porter's Five Forces Analysis Template
From Overview to Strategy Blueprint
Understanding #Paid's competitive landscape is vital. This analysis briefly examines the forces shaping its market position, including the intensity of rivalry, bargaining power of buyers, and the threat of new entrants. We've also touched on the influence of suppliers and the availability of substitutes. This brief snapshot only scratches the surface. Unlock the full Porter's Five Forces Analysis to explore #Paid’s competitive dynamics, market pressures, and strategic advantages in detail.
Suppliers Bargaining Power
Concentration of Creators
The concentration of creators on major platforms like Instagram, TikTok, and YouTube gives these platforms substantial power as suppliers of audience reach. In 2024, Instagram's ad revenue alone is projected to be over $60 billion. #Paid depends on these platforms and their APIs to manage campaigns. The top 1% of creators often command the majority of brand budgets.
Uniqueness of Creator Content
Creators with unique content or engaged audiences have strong bargaining power. This allows them to negotiate better rates and terms with platforms and brands. In 2024, the top 1% of creators earned significantly more. This shift is due to the high demand for their specialized content. They can leverage their uniqueness to secure favorable deals.
Cost of Switching for Creators
Creators often find it easy to switch between platforms or agencies, boosting their bargaining power. This flexibility lets creators seek better deals if dissatisfied. In 2024, the creator economy saw over $250 billion in market size, making platforms compete for talent. This competition boosts creators' leverage, allowing them to negotiate better terms.
Availability of Alternative Platforms for Creators
Creators aren't locked into #Paid; they can use various influencer marketing platforms and agencies to find brand deals. This competition gives creators leverage, allowing them to negotiate better rates and terms. For example, the influencer marketing industry is projected to reach $22.2 billion in 2024, with over 75% of marketers planning to use influencer marketing, showing the wide range of options. This landscape shifts the power balance.
- Market Growth: The influencer marketing industry's expansion provides creators with more choices.
- Platform Proliferation: A multitude of platforms and agencies offer creators diverse opportunities.
- Negotiating Power: Increased competition benefits creators in negotiating terms.
- Industry Investment: Marketers' continued investment in influencer marketing supports creator independence.
Forward Integration Threat from Creators
Highly successful creators or creator networks could indeed pose a threat to platforms like #Paid by integrating forward. This means they might establish direct brand relationships, reducing reliance on intermediaries. For instance, some top YouTubers have already started their own influencer marketing agencies, cutting out the middleman. This shift gives these creators more control and leverage.
- Forward integration allows creators to capture a larger share of the revenue from brand partnerships.
- Successful creators gain the ability to set their own rates and negotiate directly with brands.
- This strategy could lead to a decline in the market share for platforms like #Paid if creators opt to go direct.
- The trend highlights the evolving power dynamics in the creator economy, where creators are increasingly acting as businesses.
Creators' Power Surge: $22.2B Market & Leverage
Creators wield strong bargaining power due to platform concentration and content uniqueness. In 2024, influencer marketing hit $22.2B, boosting creator leverage. Their ability to switch platforms enhances negotiation capabilities.
| Aspect | Impact | Data (2024) |
|---|---|---|
| Market Growth | More Choices | $22.2B Influencer Market |
| Platform Proliferation | Diverse Opportunities | 75% Marketers use Influencer Marketing |
| Negotiating Power | Better Terms | Top 1% Creators Earn More |
Customers Bargaining Power
Concentration of Brands
If #Paid relies heavily on a few major clients for revenue, those clients gain strong bargaining power. In 2024, a firm with 70% revenue from top 5 clients might face intense price pressure. This concentration enables clients to demand discounts or better service terms. This can significantly impact #Paid's profitability and margins.
Availability of Alternative Marketing Channels
Brands wield significant bargaining power due to diverse marketing channels. In 2024, digital ad spending hit $300 billion. This includes options like TV, print, and paid search. This availability allows brands to negotiate better rates and terms with #Paid or explore more cost-effective alternatives.
Cost of Switching for Brands
Switching costs for brands in influencer marketing can fluctuate. Low switching costs empower brands to negotiate better terms with platforms like #Paid. According to a 2024 study, 60% of brands switch platforms within a year to optimize costs. This gives brands significant leverage.
Price Sensitivity of Brands
Brands, particularly those with restricted marketing funds, are notably price-conscious and may readily shift to rivals if #Paid's pricing isn't competitive. The digital marketing sector, valued at approximately $785.1 billion in 2023, shows intense competition, pushing brands to seek cost-effective solutions. Small and medium-sized businesses (SMBs), which make up a significant portion of #Paid's customer base, often have tight budgets, making price a critical factor in their decisions. Data from 2024 indicates that about 60% of SMBs consider pricing as their primary factor in choosing marketing services.
- Marketing Budget Constraints
- Competitive Pricing Pressure
- SMB Price Sensitivity
- Alternative Marketing Options
Backward Integration Threat from Brands
Large brands, armed with substantial resources, might choose to create their own influencer marketing teams and platforms. This move reduces their dependence on external providers like #Paid, boosting their bargaining power. The shift towards in-house solutions could lead to a decrease in demand for external influencer marketing services. In 2024, the influencer marketing industry is projected to reach $21.1 billion, yet this figure could be impacted by backward integration. This threat strengthens brands' negotiating positions.
- Backward integration allows brands to control costs.
- It enhances control over marketing strategies.
- This strategy could reduce the need for external agencies.
- Brands gain more power in negotiations.
Customer Bargaining Power: Key Financial Impacts
Customer bargaining power significantly impacts #Paid's financial outcomes. Key factors include client concentration, with concentrated revenue streams increasing price sensitivity. Brands' access to alternative marketing channels, like digital ads, empowers them to negotiate terms. Moreover, low switching costs allow brands to easily explore competitive options.
| Factor | Impact | 2024 Data Point |
|---|---|---|
| Client Concentration | Higher bargaining power | 70% revenue from top 5 clients |
| Alternative Marketing | Increased negotiation power | Digital ad spend: $300B |
| Switching Costs | Enhanced brand leverage | 60% brands switch platforms annually |
Rivalry Among Competitors
Number and Diversity of Competitors
The influencer marketing landscape is highly competitive. In 2024, the market included numerous players, from tech giants to specialized agencies. This variety and the sheer number of competitors drive intense rivalry, making it harder for any single platform to dominate. The market's value was estimated at $21.1 billion in 2023, showing its significance.
Industry Growth Rate
The influencer marketing industry's growth rate is high, with projections indicating continued expansion. Although growth can ease rivalry, the fast pace also pulls in new competitors. For instance, the global influencer market was valued at $21.1 billion in 2023. This influx of new players sustains a competitive landscape.
Differentiation Among Platforms
The ability of #Paid to distinguish itself from rivals significantly shapes competitive intensity. Offering unique features, such as its influencer marketing platform, gives it an edge. Superior customer service and niche specialization also lessen direct competition. For instance, in 2024, companies focusing on distinct influencer segments saw higher growth rates.
Switching Costs for Customers (Brands)
Low switching costs intensify competition as brands can easily shift. This often leads to price wars and innovation races. For example, the average customer churn rate in the SaaS industry was around 10-15% in 2024. Competitive rivalry escalates when retaining customers is a constant battle. This impacts profitability and market share.
- High churn rates signify easy brand switching.
- Price wars erode profit margins.
- Innovation becomes a key differentiator.
- Market share volatility increases.
Market Share Concentration
Market share concentration significantly shapes competitive rivalry within an industry. When a few major firms control most of the market, the rivalry among them can be more strategic, focusing on product differentiation and brand building. However, smaller players often face intense competition as they struggle to gain or maintain market share. For instance, in the U.S. airline industry, the top four airlines control over 70% of the market.
- High Concentration: Fewer competitors, potentially less intense rivalry among leaders.
- Low Concentration: Many competitors, often leading to intense rivalry.
- Market leaders often focus on brand building and differentiation.
- Smaller players compete fiercely for market share.
Influencer Marketing: Fierce Competition Ahead!
Competitive rivalry in influencer marketing is intense, driven by numerous players and rapid market growth. Low switching costs and high churn rates exacerbate competition, leading to price wars and innovation races. Market share concentration also shapes rivalry; fewer dominant firms might see strategic competition, while many smaller players battle fiercely.
| Factor | Impact | Example (2024 Data) |
|---|---|---|
| Market Growth | Attracts new entrants, increasing competition. | Influencer market valued at $21.1B in 2023, growing rapidly. |
| Switching Costs | Low costs intensify rivalry. | SaaS churn rates ~10-15%. |
| Market Concentration | Influences competitive strategy. | Top 4 US airlines control over 70% market share. |
Product Information
Product Information
Shipping & Returns
Shipping & Returns
Description
What is included in the product
Tailored exclusively for #Paid, analyzing its position within its competitive landscape.
Customize pressure levels based on new data and evolving market trends.
Preview the Actual Deliverable
#Paid Porter's Five Forces Analysis
This preview showcases the exact #Paid Porter's Five Forces analysis you'll receive after purchase—a comprehensive, ready-to-use document.
Porter's Five Forces Analysis Template
From Overview to Strategy Blueprint
Understanding #Paid's competitive landscape is vital. This analysis briefly examines the forces shaping its market position, including the intensity of rivalry, bargaining power of buyers, and the threat of new entrants. We've also touched on the influence of suppliers and the availability of substitutes. This brief snapshot only scratches the surface. Unlock the full Porter's Five Forces Analysis to explore #Paid’s competitive dynamics, market pressures, and strategic advantages in detail.
Suppliers Bargaining Power
Concentration of Creators
The concentration of creators on major platforms like Instagram, TikTok, and YouTube gives these platforms substantial power as suppliers of audience reach. In 2024, Instagram's ad revenue alone is projected to be over $60 billion. #Paid depends on these platforms and their APIs to manage campaigns. The top 1% of creators often command the majority of brand budgets.
Uniqueness of Creator Content
Creators with unique content or engaged audiences have strong bargaining power. This allows them to negotiate better rates and terms with platforms and brands. In 2024, the top 1% of creators earned significantly more. This shift is due to the high demand for their specialized content. They can leverage their uniqueness to secure favorable deals.
Cost of Switching for Creators
Creators often find it easy to switch between platforms or agencies, boosting their bargaining power. This flexibility lets creators seek better deals if dissatisfied. In 2024, the creator economy saw over $250 billion in market size, making platforms compete for talent. This competition boosts creators' leverage, allowing them to negotiate better terms.
Availability of Alternative Platforms for Creators
Creators aren't locked into #Paid; they can use various influencer marketing platforms and agencies to find brand deals. This competition gives creators leverage, allowing them to negotiate better rates and terms. For example, the influencer marketing industry is projected to reach $22.2 billion in 2024, with over 75% of marketers planning to use influencer marketing, showing the wide range of options. This landscape shifts the power balance.
- Market Growth: The influencer marketing industry's expansion provides creators with more choices.
- Platform Proliferation: A multitude of platforms and agencies offer creators diverse opportunities.
- Negotiating Power: Increased competition benefits creators in negotiating terms.
- Industry Investment: Marketers' continued investment in influencer marketing supports creator independence.
Forward Integration Threat from Creators
Highly successful creators or creator networks could indeed pose a threat to platforms like #Paid by integrating forward. This means they might establish direct brand relationships, reducing reliance on intermediaries. For instance, some top YouTubers have already started their own influencer marketing agencies, cutting out the middleman. This shift gives these creators more control and leverage.
- Forward integration allows creators to capture a larger share of the revenue from brand partnerships.
- Successful creators gain the ability to set their own rates and negotiate directly with brands.
- This strategy could lead to a decline in the market share for platforms like #Paid if creators opt to go direct.
- The trend highlights the evolving power dynamics in the creator economy, where creators are increasingly acting as businesses.
Creators' Power Surge: $22.2B Market & Leverage
Creators wield strong bargaining power due to platform concentration and content uniqueness. In 2024, influencer marketing hit $22.2B, boosting creator leverage. Their ability to switch platforms enhances negotiation capabilities.
| Aspect | Impact | Data (2024) |
|---|---|---|
| Market Growth | More Choices | $22.2B Influencer Market |
| Platform Proliferation | Diverse Opportunities | 75% Marketers use Influencer Marketing |
| Negotiating Power | Better Terms | Top 1% Creators Earn More |
Customers Bargaining Power
Concentration of Brands
If #Paid relies heavily on a few major clients for revenue, those clients gain strong bargaining power. In 2024, a firm with 70% revenue from top 5 clients might face intense price pressure. This concentration enables clients to demand discounts or better service terms. This can significantly impact #Paid's profitability and margins.
Availability of Alternative Marketing Channels
Brands wield significant bargaining power due to diverse marketing channels. In 2024, digital ad spending hit $300 billion. This includes options like TV, print, and paid search. This availability allows brands to negotiate better rates and terms with #Paid or explore more cost-effective alternatives.
Cost of Switching for Brands
Switching costs for brands in influencer marketing can fluctuate. Low switching costs empower brands to negotiate better terms with platforms like #Paid. According to a 2024 study, 60% of brands switch platforms within a year to optimize costs. This gives brands significant leverage.
Price Sensitivity of Brands
Brands, particularly those with restricted marketing funds, are notably price-conscious and may readily shift to rivals if #Paid's pricing isn't competitive. The digital marketing sector, valued at approximately $785.1 billion in 2023, shows intense competition, pushing brands to seek cost-effective solutions. Small and medium-sized businesses (SMBs), which make up a significant portion of #Paid's customer base, often have tight budgets, making price a critical factor in their decisions. Data from 2024 indicates that about 60% of SMBs consider pricing as their primary factor in choosing marketing services.
- Marketing Budget Constraints
- Competitive Pricing Pressure
- SMB Price Sensitivity
- Alternative Marketing Options
Backward Integration Threat from Brands
Large brands, armed with substantial resources, might choose to create their own influencer marketing teams and platforms. This move reduces their dependence on external providers like #Paid, boosting their bargaining power. The shift towards in-house solutions could lead to a decrease in demand for external influencer marketing services. In 2024, the influencer marketing industry is projected to reach $21.1 billion, yet this figure could be impacted by backward integration. This threat strengthens brands' negotiating positions.
- Backward integration allows brands to control costs.
- It enhances control over marketing strategies.
- This strategy could reduce the need for external agencies.
- Brands gain more power in negotiations.
Customer Bargaining Power: Key Financial Impacts
Customer bargaining power significantly impacts #Paid's financial outcomes. Key factors include client concentration, with concentrated revenue streams increasing price sensitivity. Brands' access to alternative marketing channels, like digital ads, empowers them to negotiate terms. Moreover, low switching costs allow brands to easily explore competitive options.
| Factor | Impact | 2024 Data Point |
|---|---|---|
| Client Concentration | Higher bargaining power | 70% revenue from top 5 clients |
| Alternative Marketing | Increased negotiation power | Digital ad spend: $300B |
| Switching Costs | Enhanced brand leverage | 60% brands switch platforms annually |
Rivalry Among Competitors
Number and Diversity of Competitors
The influencer marketing landscape is highly competitive. In 2024, the market included numerous players, from tech giants to specialized agencies. This variety and the sheer number of competitors drive intense rivalry, making it harder for any single platform to dominate. The market's value was estimated at $21.1 billion in 2023, showing its significance.
Industry Growth Rate
The influencer marketing industry's growth rate is high, with projections indicating continued expansion. Although growth can ease rivalry, the fast pace also pulls in new competitors. For instance, the global influencer market was valued at $21.1 billion in 2023. This influx of new players sustains a competitive landscape.
Differentiation Among Platforms
The ability of #Paid to distinguish itself from rivals significantly shapes competitive intensity. Offering unique features, such as its influencer marketing platform, gives it an edge. Superior customer service and niche specialization also lessen direct competition. For instance, in 2024, companies focusing on distinct influencer segments saw higher growth rates.
Switching Costs for Customers (Brands)
Low switching costs intensify competition as brands can easily shift. This often leads to price wars and innovation races. For example, the average customer churn rate in the SaaS industry was around 10-15% in 2024. Competitive rivalry escalates when retaining customers is a constant battle. This impacts profitability and market share.
- High churn rates signify easy brand switching.
- Price wars erode profit margins.
- Innovation becomes a key differentiator.
- Market share volatility increases.
Market Share Concentration
Market share concentration significantly shapes competitive rivalry within an industry. When a few major firms control most of the market, the rivalry among them can be more strategic, focusing on product differentiation and brand building. However, smaller players often face intense competition as they struggle to gain or maintain market share. For instance, in the U.S. airline industry, the top four airlines control over 70% of the market.
- High Concentration: Fewer competitors, potentially less intense rivalry among leaders.
- Low Concentration: Many competitors, often leading to intense rivalry.
- Market leaders often focus on brand building and differentiation.
- Smaller players compete fiercely for market share.
Influencer Marketing: Fierce Competition Ahead!
Competitive rivalry in influencer marketing is intense, driven by numerous players and rapid market growth. Low switching costs and high churn rates exacerbate competition, leading to price wars and innovation races. Market share concentration also shapes rivalry; fewer dominant firms might see strategic competition, while many smaller players battle fiercely.
| Factor | Impact | Example (2024 Data) |
|---|---|---|
| Market Growth | Attracts new entrants, increasing competition. | Influencer market valued at $21.1B in 2023, growing rapidly. |
| Switching Costs | Low costs intensify rivalry. | SaaS churn rates ~10-15%. |
| Market Concentration | Influences competitive strategy. | Top 4 US airlines control over 70% market share. |


