SAFARICOM BCG MATRIX TEMPLATE RESEARCH
Unlock Strategic Clarity
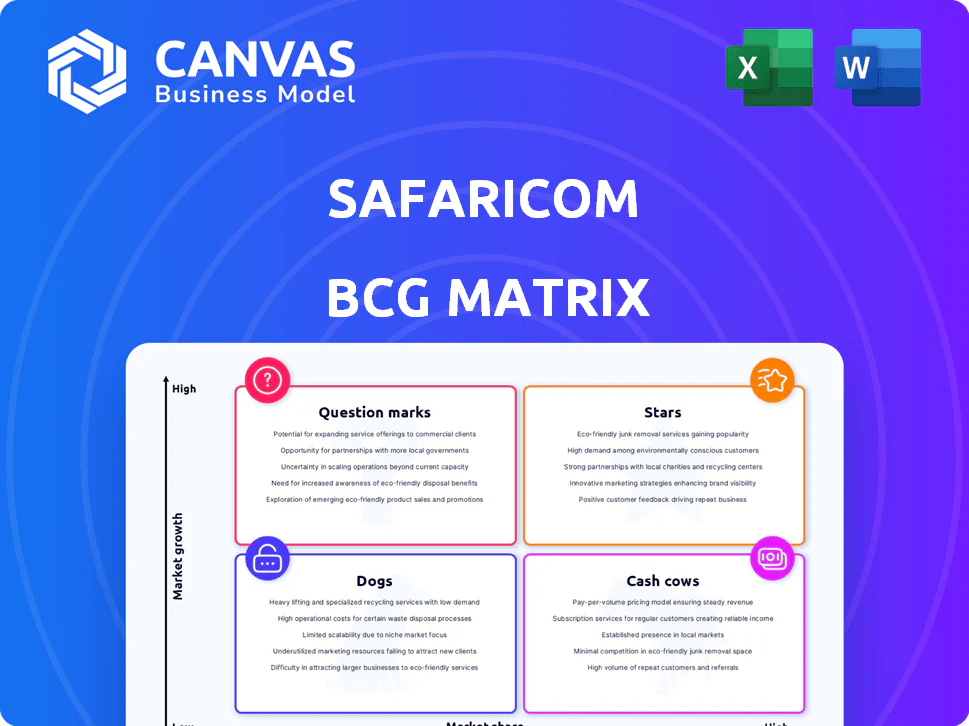
Safaricom's strategic footprint mixes high-growth mobile money (a clear Star) with mature voice/data services that act as Cash Cows supporting expansion; a few legacy offerings trend toward Dogs, while emerging IoT and enterprise solutions sit in the Question Mark quadrant with upside if funded wisely. Dive deeper into this company's BCG Matrix and gain a clear view of where its products stand-Stars, Cash Cows, Dogs, or Question Marks. Purchase the full version for a complete breakdown and strategic insights you can act on.
Stars
Safaricom Ethiopia Expansion
Safaricom Ethiopia is a Star: active subscribers surged 71.7% y/y to 12.2 million by Dec 2025, making it a high-growth engine for Safaricom Company.
Q3 FY2026 service revenue jumped 54.2% to KES 9.68 billion, led by mobile data which contributes 67% of segment earnings.
Despite high market entry costs and currency reforms, management pushed EBITDA breakeven to 2027, keeping the unit central to regional dominance.
Mobile Data Services
Mobile Data Services is a Star for Safaricom, with revenue up 16.5% to KES 78.5 billion in FY2025 as the firm pivots to a TechCo.
Usage rose 15.2% and 5G rollout reached over 1,700 active sites covering 30% of the population, driving higher ARPU.
Subscribers consuming >1GB/month grew 18.1% by late 2025, shifting demand to high-value services and supporting further network investment.

M-Pesa Business & Merchant Payments
M-Pesa Business & Merchant Payments are Stars: Lipa Na M-Pesa and Pochi la Biashara saw merchant transaction volumes jump 95.6% to KES 153.4 billion by late 2025, while business payment revenue climbed 18.4% to KES 27.0 billion in H1 FY2026, signaling rapid cashless adoption and share gains from banks via automated B2C/C2B flows.
Fixed Data and Fiber-to-the-Home (FTTH)
Safaricom's fixed internet is a Star: 35.6% market share in Kenya with 815,000+ subscriptions (Sep 2025), FTTH customers up 35.1% YoY, and fiber footprint at 18,300+ km driving double-digit revenue growth while consuming heavy capex to reach 1M premises by 2030.
- 35.6% market share; 815,000+ subs (Sep 2025)
Internet of Things (IoT) and Cloud Solutions
Safaricom's IoT and cloud solutions are a Star: IoT revenue rose 19.8% to KES 571 million in H1 FY2026 with 1.81 million active IoT customers, and cloud services tie into fleet management and smart utilities, making Safaricom a critical infrastructure partner for Kenyan enterprises.
High-growth segment: small current revenue but strong momentum, backed by Safaricom's $500 million AI investment and integration into enterprise operations - clear Star status.
- IoT revenue H1 FY2026: KES 571 million
- Growth H1 FY2026: 19.8%
- Active IoT customers: 1.81 million
- AI investment: $500 million
- Use cases: fleet management, smart utilities
Safaricom surge: Ethiopia +71.7% to 12.2m; Mobile data KES78.5bn; FTTH 815k+
Safaricom Company Stars: Ethiopia subs +71.7% to 12.2m (Dec 2025); Q3 FY2026 service rev KES 9.68bn (+54.2%); Mobile Data FY2025 rev KES 78.5bn (+16.5%); FTTH 815,000+ subs (Sep 2025); M-Pesa merchant volume KES 153.4bn; IoT H1 FY2026 rev KES 571m.
| Unit | Metric | Value (2025/26) |
|---|---|---|
| Ethiopia | Active subs | 12.2m |
| Mobile Data | Revenue FY2025 | KES 78.5bn |
| FTTH | Subs Sep 2025 | 815,000+ |
| M-Pesa | Merchant vol | KES 153.4bn |
| IoT | H1 FY2026 rev | KES 571m |
What is included in the product
Comprehensive BCG review of Safaricom's portfolio-stars, cash cows, question marks, dogs-with strategic invest/hold/divest guidance and trend context.
One-page Safaricom BCG Matrix placing each business unit in a quadrant for instant strategic clarity.
Cash Cows
M-Pesa Consumer Payments
M-Pesa remains Safaricom's cash cow, generating KES 161.1 billion in FY2025 and supplying 41.5% of Group earnings, funding capex in Ethiopia while supporting a KES 1.20 per share dividend.
Despite Airtel Money pressure, M-Pesa holds a 90.8% Kenyan market share and processes over 2,600 transactions/sec, reflecting platform scale and steady cash flow.
Legacy Mobile Voice Services
Legacy Mobile Voice Services remain Safaricom's reliable cash cow: voice revenue rose 1.6% to KES 80.8 billion in FY2025, underpinning operating cash flow despite global declines.
Voice now represents ~21% of service revenue versus 64% a decade ago, yet still serves the largest share of 48.2 million active SIMs, preserving scale advantages.
Marketing and capex needs are low versus digital services, so voice continues to supply stable liquidity and fund growth initiatives.

SMS and Messaging Services
Messaging services remain a Cash Cow for Safaricom, delivering KES 12.6 billion in FY2025 with 1.9% growth and >40% EBITDA margin driven by high-margin A2P traffic (bank alerts, 2FA).
Enterprise Connectivity (Leased Lines)
Safaricom's leased-line enterprise connectivity delivers stable, recurring revenue from top-tier corporates and government, driving KES 9.51 billion in enterprise revenue in FY2025, up 10.2%, and fixed services including FTTH now make up 5.0% of Kenya service revenue.
Long-term contracts yield predictable cash flows, less tied to consumer airtime cycles and economic swings.
- KES 9.51 billion enterprise revenue (FY2025)
- 10.2% YoY growth in enterprise segment
- Fixed/FTTH = 5.0% of Kenya service revenue
- High contract duration → predictable cash flows
Consumer Mobile Interconnect Revenue
As market leader with 63.3% of subscriptions, Safaricom is a net receiver of interconnect fees; Kenyan on-net traffic drives steady margins while Ethiopia incoming mobile revenue rose 1.8% to KES 367 million in FY2025, adding passive, high-margin cash flow.
- 63.3% market share - dominant subscriber base
- KES 367m mobile incoming revenue in Ethiopia (FY2025), +1.8%
- Kenyan on-net community sustains low marginal cost, high margins
- Passive, recurring cash cow supporting EBITDA
Safaricom cash cows - M-Pesa, Voice & Messaging fuel high‑margin growth
M-Pesa (KES 161.1bn, 41.5% earnings), Voice (KES 80.8bn, 21% service revenue), Messaging (KES 12.6bn, >40% EBITDA), Enterprise (KES 9.51bn, +10.2%) and incoming mobile (KES 0.367bn, +1.8%) are Safaricom cash cows providing steady, high-margin cash flow to fund growth.
| Asset | FY2025 | % |
|---|---|---|
| M-Pesa | KES 161.1bn | 41.5% earnings |
| Voice | KES 80.8bn | 21% svc rev |
| Messaging | KES 12.6bn | >40% EBITDA |
| Enterprise | KES 9.51bn | +10.2% YoY |
| Incoming | KES 0.367bn | +1.8% YoY |
What You See Is What You Get
Safaricom BCG Matrix
The file you're previewing on this page is the final Safaricom BCG Matrix you'll receive after purchase-no watermarks, no demo labels-just a fully formatted, analysis-ready report built for strategic clarity and professional use.

SAFARICOM BCG MATRIX TEMPLATE RESEARCH
Unlock Strategic Clarity
Safaricom's strategic footprint mixes high-growth mobile money (a clear Star) with mature voice/data services that act as Cash Cows supporting expansion; a few legacy offerings trend toward Dogs, while emerging IoT and enterprise solutions sit in the Question Mark quadrant with upside if funded wisely. Dive deeper into this company's BCG Matrix and gain a clear view of where its products stand-Stars, Cash Cows, Dogs, or Question Marks. Purchase the full version for a complete breakdown and strategic insights you can act on.
Stars
Safaricom Ethiopia Expansion
Safaricom Ethiopia is a Star: active subscribers surged 71.7% y/y to 12.2 million by Dec 2025, making it a high-growth engine for Safaricom Company.
Q3 FY2026 service revenue jumped 54.2% to KES 9.68 billion, led by mobile data which contributes 67% of segment earnings.
Despite high market entry costs and currency reforms, management pushed EBITDA breakeven to 2027, keeping the unit central to regional dominance.
Mobile Data Services
Mobile Data Services is a Star for Safaricom, with revenue up 16.5% to KES 78.5 billion in FY2025 as the firm pivots to a TechCo.
Usage rose 15.2% and 5G rollout reached over 1,700 active sites covering 30% of the population, driving higher ARPU.
Subscribers consuming >1GB/month grew 18.1% by late 2025, shifting demand to high-value services and supporting further network investment.
M-Pesa Business & Merchant Payments
M-Pesa Business & Merchant Payments are Stars: Lipa Na M-Pesa and Pochi la Biashara saw merchant transaction volumes jump 95.6% to KES 153.4 billion by late 2025, while business payment revenue climbed 18.4% to KES 27.0 billion in H1 FY2026, signaling rapid cashless adoption and share gains from banks via automated B2C/C2B flows.
Fixed Data and Fiber-to-the-Home (FTTH)
Safaricom's fixed internet is a Star: 35.6% market share in Kenya with 815,000+ subscriptions (Sep 2025), FTTH customers up 35.1% YoY, and fiber footprint at 18,300+ km driving double-digit revenue growth while consuming heavy capex to reach 1M premises by 2030.
- 35.6% market share; 815,000+ subs (Sep 2025)
Internet of Things (IoT) and Cloud Solutions
Safaricom's IoT and cloud solutions are a Star: IoT revenue rose 19.8% to KES 571 million in H1 FY2026 with 1.81 million active IoT customers, and cloud services tie into fleet management and smart utilities, making Safaricom a critical infrastructure partner for Kenyan enterprises.
High-growth segment: small current revenue but strong momentum, backed by Safaricom's $500 million AI investment and integration into enterprise operations - clear Star status.
- IoT revenue H1 FY2026: KES 571 million
- Growth H1 FY2026: 19.8%
- Active IoT customers: 1.81 million
- AI investment: $500 million
- Use cases: fleet management, smart utilities
Safaricom surge: Ethiopia +71.7% to 12.2m; Mobile data KES78.5bn; FTTH 815k+
Safaricom Company Stars: Ethiopia subs +71.7% to 12.2m (Dec 2025); Q3 FY2026 service rev KES 9.68bn (+54.2%); Mobile Data FY2025 rev KES 78.5bn (+16.5%); FTTH 815,000+ subs (Sep 2025); M-Pesa merchant volume KES 153.4bn; IoT H1 FY2026 rev KES 571m.
| Unit | Metric | Value (2025/26) |
|---|---|---|
| Ethiopia | Active subs | 12.2m |
| Mobile Data | Revenue FY2025 | KES 78.5bn |
| FTTH | Subs Sep 2025 | 815,000+ |
| M-Pesa | Merchant vol | KES 153.4bn |
| IoT | H1 FY2026 rev | KES 571m |
What is included in the product
Comprehensive BCG review of Safaricom's portfolio-stars, cash cows, question marks, dogs-with strategic invest/hold/divest guidance and trend context.
One-page Safaricom BCG Matrix placing each business unit in a quadrant for instant strategic clarity.
Cash Cows
M-Pesa Consumer Payments
M-Pesa remains Safaricom's cash cow, generating KES 161.1 billion in FY2025 and supplying 41.5% of Group earnings, funding capex in Ethiopia while supporting a KES 1.20 per share dividend.
Despite Airtel Money pressure, M-Pesa holds a 90.8% Kenyan market share and processes over 2,600 transactions/sec, reflecting platform scale and steady cash flow.
Legacy Mobile Voice Services
Legacy Mobile Voice Services remain Safaricom's reliable cash cow: voice revenue rose 1.6% to KES 80.8 billion in FY2025, underpinning operating cash flow despite global declines.
Voice now represents ~21% of service revenue versus 64% a decade ago, yet still serves the largest share of 48.2 million active SIMs, preserving scale advantages.
Marketing and capex needs are low versus digital services, so voice continues to supply stable liquidity and fund growth initiatives.
SMS and Messaging Services
Messaging services remain a Cash Cow for Safaricom, delivering KES 12.6 billion in FY2025 with 1.9% growth and >40% EBITDA margin driven by high-margin A2P traffic (bank alerts, 2FA).
Enterprise Connectivity (Leased Lines)
Safaricom's leased-line enterprise connectivity delivers stable, recurring revenue from top-tier corporates and government, driving KES 9.51 billion in enterprise revenue in FY2025, up 10.2%, and fixed services including FTTH now make up 5.0% of Kenya service revenue.
Long-term contracts yield predictable cash flows, less tied to consumer airtime cycles and economic swings.
- KES 9.51 billion enterprise revenue (FY2025)
- 10.2% YoY growth in enterprise segment
- Fixed/FTTH = 5.0% of Kenya service revenue
- High contract duration → predictable cash flows
Consumer Mobile Interconnect Revenue
As market leader with 63.3% of subscriptions, Safaricom is a net receiver of interconnect fees; Kenyan on-net traffic drives steady margins while Ethiopia incoming mobile revenue rose 1.8% to KES 367 million in FY2025, adding passive, high-margin cash flow.
- 63.3% market share - dominant subscriber base
- KES 367m mobile incoming revenue in Ethiopia (FY2025), +1.8%
- Kenyan on-net community sustains low marginal cost, high margins
- Passive, recurring cash cow supporting EBITDA
Safaricom cash cows - M-Pesa, Voice & Messaging fuel high‑margin growth
M-Pesa (KES 161.1bn, 41.5% earnings), Voice (KES 80.8bn, 21% service revenue), Messaging (KES 12.6bn, >40% EBITDA), Enterprise (KES 9.51bn, +10.2%) and incoming mobile (KES 0.367bn, +1.8%) are Safaricom cash cows providing steady, high-margin cash flow to fund growth.
| Asset | FY2025 | % |
|---|---|---|
| M-Pesa | KES 161.1bn | 41.5% earnings |
| Voice | KES 80.8bn | 21% svc rev |
| Messaging | KES 12.6bn | >40% EBITDA |
| Enterprise | KES 9.51bn | +10.2% YoY |
| Incoming | KES 0.367bn | +1.8% YoY |
What You See Is What You Get
Safaricom BCG Matrix
The file you're previewing on this page is the final Safaricom BCG Matrix you'll receive after purchase-no watermarks, no demo labels-just a fully formatted, analysis-ready report built for strategic clarity and professional use.
Product Information
Product Information
Shipping & Returns
Shipping & Returns
Description
Unlock Strategic Clarity
Safaricom's strategic footprint mixes high-growth mobile money (a clear Star) with mature voice/data services that act as Cash Cows supporting expansion; a few legacy offerings trend toward Dogs, while emerging IoT and enterprise solutions sit in the Question Mark quadrant with upside if funded wisely. Dive deeper into this company's BCG Matrix and gain a clear view of where its products stand-Stars, Cash Cows, Dogs, or Question Marks. Purchase the full version for a complete breakdown and strategic insights you can act on.
Stars
Safaricom Ethiopia Expansion
Safaricom Ethiopia is a Star: active subscribers surged 71.7% y/y to 12.2 million by Dec 2025, making it a high-growth engine for Safaricom Company.
Q3 FY2026 service revenue jumped 54.2% to KES 9.68 billion, led by mobile data which contributes 67% of segment earnings.
Despite high market entry costs and currency reforms, management pushed EBITDA breakeven to 2027, keeping the unit central to regional dominance.
Mobile Data Services
Mobile Data Services is a Star for Safaricom, with revenue up 16.5% to KES 78.5 billion in FY2025 as the firm pivots to a TechCo.
Usage rose 15.2% and 5G rollout reached over 1,700 active sites covering 30% of the population, driving higher ARPU.
Subscribers consuming >1GB/month grew 18.1% by late 2025, shifting demand to high-value services and supporting further network investment.
M-Pesa Business & Merchant Payments
M-Pesa Business & Merchant Payments are Stars: Lipa Na M-Pesa and Pochi la Biashara saw merchant transaction volumes jump 95.6% to KES 153.4 billion by late 2025, while business payment revenue climbed 18.4% to KES 27.0 billion in H1 FY2026, signaling rapid cashless adoption and share gains from banks via automated B2C/C2B flows.
Fixed Data and Fiber-to-the-Home (FTTH)
Safaricom's fixed internet is a Star: 35.6% market share in Kenya with 815,000+ subscriptions (Sep 2025), FTTH customers up 35.1% YoY, and fiber footprint at 18,300+ km driving double-digit revenue growth while consuming heavy capex to reach 1M premises by 2030.
- 35.6% market share; 815,000+ subs (Sep 2025)
Internet of Things (IoT) and Cloud Solutions
Safaricom's IoT and cloud solutions are a Star: IoT revenue rose 19.8% to KES 571 million in H1 FY2026 with 1.81 million active IoT customers, and cloud services tie into fleet management and smart utilities, making Safaricom a critical infrastructure partner for Kenyan enterprises.
High-growth segment: small current revenue but strong momentum, backed by Safaricom's $500 million AI investment and integration into enterprise operations - clear Star status.
- IoT revenue H1 FY2026: KES 571 million
- Growth H1 FY2026: 19.8%
- Active IoT customers: 1.81 million
- AI investment: $500 million
- Use cases: fleet management, smart utilities
Safaricom surge: Ethiopia +71.7% to 12.2m; Mobile data KES78.5bn; FTTH 815k+
Safaricom Company Stars: Ethiopia subs +71.7% to 12.2m (Dec 2025); Q3 FY2026 service rev KES 9.68bn (+54.2%); Mobile Data FY2025 rev KES 78.5bn (+16.5%); FTTH 815,000+ subs (Sep 2025); M-Pesa merchant volume KES 153.4bn; IoT H1 FY2026 rev KES 571m.
| Unit | Metric | Value (2025/26) |
|---|---|---|
| Ethiopia | Active subs | 12.2m |
| Mobile Data | Revenue FY2025 | KES 78.5bn |
| FTTH | Subs Sep 2025 | 815,000+ |
| M-Pesa | Merchant vol | KES 153.4bn |
| IoT | H1 FY2026 rev | KES 571m |
What is included in the product
Comprehensive BCG review of Safaricom's portfolio-stars, cash cows, question marks, dogs-with strategic invest/hold/divest guidance and trend context.
One-page Safaricom BCG Matrix placing each business unit in a quadrant for instant strategic clarity.
Cash Cows
M-Pesa Consumer Payments
M-Pesa remains Safaricom's cash cow, generating KES 161.1 billion in FY2025 and supplying 41.5% of Group earnings, funding capex in Ethiopia while supporting a KES 1.20 per share dividend.
Despite Airtel Money pressure, M-Pesa holds a 90.8% Kenyan market share and processes over 2,600 transactions/sec, reflecting platform scale and steady cash flow.
Legacy Mobile Voice Services
Legacy Mobile Voice Services remain Safaricom's reliable cash cow: voice revenue rose 1.6% to KES 80.8 billion in FY2025, underpinning operating cash flow despite global declines.
Voice now represents ~21% of service revenue versus 64% a decade ago, yet still serves the largest share of 48.2 million active SIMs, preserving scale advantages.
Marketing and capex needs are low versus digital services, so voice continues to supply stable liquidity and fund growth initiatives.
SMS and Messaging Services
Messaging services remain a Cash Cow for Safaricom, delivering KES 12.6 billion in FY2025 with 1.9% growth and >40% EBITDA margin driven by high-margin A2P traffic (bank alerts, 2FA).
Enterprise Connectivity (Leased Lines)
Safaricom's leased-line enterprise connectivity delivers stable, recurring revenue from top-tier corporates and government, driving KES 9.51 billion in enterprise revenue in FY2025, up 10.2%, and fixed services including FTTH now make up 5.0% of Kenya service revenue.
Long-term contracts yield predictable cash flows, less tied to consumer airtime cycles and economic swings.
- KES 9.51 billion enterprise revenue (FY2025)
- 10.2% YoY growth in enterprise segment
- Fixed/FTTH = 5.0% of Kenya service revenue
- High contract duration → predictable cash flows
Consumer Mobile Interconnect Revenue
As market leader with 63.3% of subscriptions, Safaricom is a net receiver of interconnect fees; Kenyan on-net traffic drives steady margins while Ethiopia incoming mobile revenue rose 1.8% to KES 367 million in FY2025, adding passive, high-margin cash flow.
- 63.3% market share - dominant subscriber base
- KES 367m mobile incoming revenue in Ethiopia (FY2025), +1.8%
- Kenyan on-net community sustains low marginal cost, high margins
- Passive, recurring cash cow supporting EBITDA
Safaricom cash cows - M-Pesa, Voice & Messaging fuel high‑margin growth
M-Pesa (KES 161.1bn, 41.5% earnings), Voice (KES 80.8bn, 21% service revenue), Messaging (KES 12.6bn, >40% EBITDA), Enterprise (KES 9.51bn, +10.2%) and incoming mobile (KES 0.367bn, +1.8%) are Safaricom cash cows providing steady, high-margin cash flow to fund growth.
| Asset | FY2025 | % |
|---|---|---|
| M-Pesa | KES 161.1bn | 41.5% earnings |
| Voice | KES 80.8bn | 21% svc rev |
| Messaging | KES 12.6bn | >40% EBITDA |
| Enterprise | KES 9.51bn | +10.2% YoY |
| Incoming | KES 0.367bn | +1.8% YoY |
What You See Is What You Get
Safaricom BCG Matrix
The file you're previewing on this page is the final Safaricom BCG Matrix you'll receive after purchase-no watermarks, no demo labels-just a fully formatted, analysis-ready report built for strategic clarity and professional use.


