TELEFONICA BCG MATRIX TEMPLATE RESEARCH
Visual. Strategic. Downloadable.
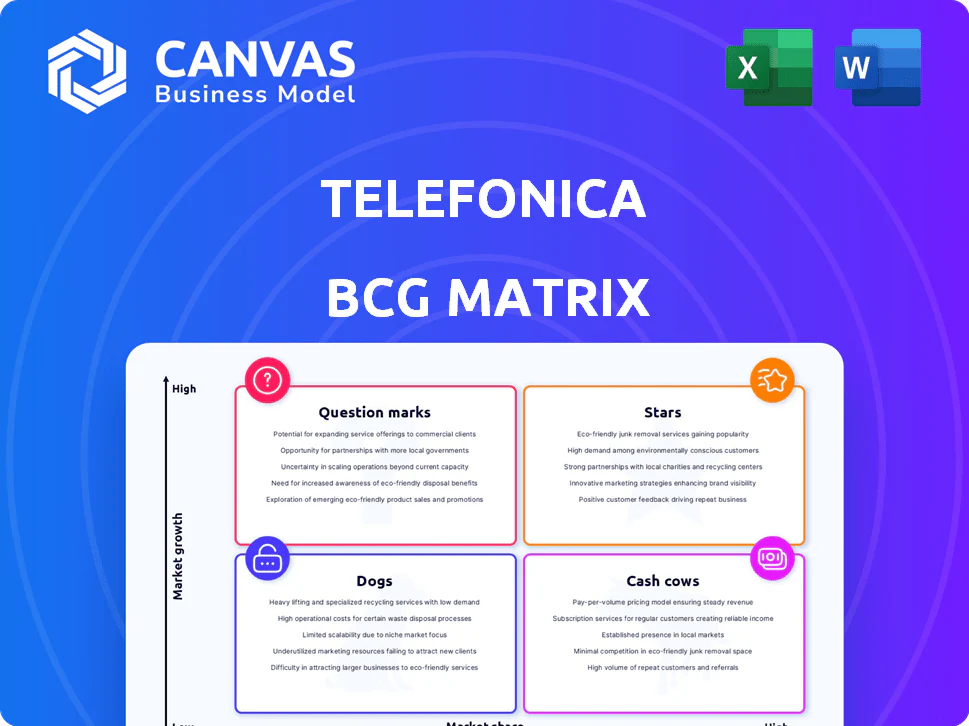
Telefónica's BCG Matrix snapshot highlights how legacy mobile and fixed-line services act as Cash Cows funding growth areas like fiber broadband and digital services that could be Stars or Question Marks depending on regional momentum; meanwhile, underperforming legacy assets risk becoming Dogs without targeted restructuring. Dive deeper into this company's BCG Matrix and gain a clear view of where its products stand-Stars, Cash Cows, Dogs, or Question Marks. Purchase the full version for a complete breakdown and strategic insights you can act on.
Stars
Telefónica Tech Revenue Growth of 18.9%
Telefónica Tech, the group's crown jewel, grew revenue 18.9% to €2.22 billion in FY2025, driven by strong demand in Cybersecurity, Cloud and Big Data; it now outpaces the core connectivity arm with sustained double-digit momentum.
Vivo Brazil Mobile Service Revenue up 7.1%
Vivo Brazil Mobile Service Revenue up 7.1%: Telefónica's Vivo reported R$15.6 billion in Q4 2025 revenue, marking it as a high-growth Star in a consolidating market.
Vivo holds 19.3% fiber market share and a dominant mobile position, moving from growth into a cash-generating leader.
Annual net profit rose 11.2% in 2025, reflecting payoff from aggressive 5G and FTTH rollouts across Brazil.

5G Standalone (SA) Coverage at 80% to 98%
By late 2025, Telefónica's 5G Standalone (SA) coverage hit 98% in Germany and 92% in Spain, making these markets high-share leaders in a high-growth infrastructure race.
These networks are Stars in the BCG matrix because they need heavy ongoing CapEx-€2.0 billion in H1 2025-while driving future B2B and Open Gateway API revenue streams.
This CapEx funds low-latency, network-slicing and edge capabilities that underpin expected mobile data monetization over the next decade.
Telefónica Open Gateway Production APIs
Telefónica Open Gateway moved from prototype to production in 2025; partners like Itaú Bank now run 5 million SIM-swap validations monthly via its Production APIs, validating identity and reducing fraud.
This sits in Telefonica BCG Matrix as a Question/Star: Network-as-a-Service shows high growth and Telefónica holds early leadership, targeting a multi-billion market for programmable network services.
By packaging network functions as code, Telefónica unlocked a high-margin revenue stream absent in 2022; 2025 pilot-to-scale revenues are estimated at €120-€180m annual run-rate across partners.
- 5M validations/month (Itaú, SIM-swap)
- 2025 run-rate revenue €120-€180m
- Market: multi-billion Network-as-a-Service
- High growth, early leadership → Star positioning
B2B Digital Services Surging 29.5%
B2B digital services grew 29.5% in 2025, with Telefónica's Brazil B2B digital revenues hitting R$5.3 billion, showing strong leadership in enterprise IoT and AI solutions versus slower B2C trends.
High market share in corporate accounts plus rapid digital demand makes this a classic Star in Telefónica's BCG matrix, driving margin expansion and cross-sell opportunities.
- 2025 growth: 29.5%
- Brazil B2B digital revenue: R$5.3 billion (2025)
- Outstrips B2C growth; IoT/AI adoption rising
- Star: high share + high growth → invest to scale
Telefónica Tech €2.22bn; Vivo Q4 R$15.6bn, 19.3% fiber; 5G SA DE98%/ES92%
Stars: Telefónica Tech €2.22bn rev (2025,+18.9%); Vivo Brazil R$15.6bn Q4 rev, 19.3% fiber share; 5G SA coverage DE 98%/ES 92%; Network-as-a-Service run-rate €120-€180m; Brazil B2B digital R$5.3bn (+29.5%).
| Unit | 2025 |
|---|---|
| Telefónica Tech rev | €2.22bn |
| Vivo Q4 rev | R$15.6bn |
| Fiber share Vivo | 19.3% |
| 5G SA cov. (DE/ES) | 98% / 92% |
| NaaS run-rate | €120-€180m |
| Brazil B2B digital | R$5.3bn |
What is included in the product
Comprehensive BCG Matrix review of Telefónica's units with strategic actions for Stars, Cash Cows, Question Marks, and Dogs.
One-page BCG matrix placing Telefónica's units in quadrants for quick portfolio decisions and executive-ready printing.
Cash Cows
Telefónica España Best Year Since 2018
Telefónica España delivered its best year since 2018 in FY2025: revenue rose 4.2% to €12.4bn, EBITDA grew 6.8% to €5.6bn and operating cash flow (Free Cash Flow) hit €2.1bn, marking simultaneous growth in all three metrics for the first time in 17 years.
It remains Telefonica's ultimate Cash Cow, funding the group's €0.30 per-share dividend and covering ~55% of group capex in 2025.
With 5G and fiber rollouts largely complete-fiber coverage ~92% households and 5G population ~88%-the strategy shifts from building to milking the most advanced network in Europe.
Fiber-to-the-Home (FTTH) with 162.9 Million Premises
Telefónica now operates one of the world's largest fiber footprints with 74.3 million FTTH premises passed as of end-2025, contributing to a total 162.9 million premises across technologies.
FTTH is a Cash Cow: heavy build capex is largely complete, yielding high-margin, recurring subscription revenue and low churn, boosting EBITDA margins.
Premises passed grew 7% in 2025, so expansion continues but the primary role is steady, predictable cash flow supporting dividends and network services investment.

Postpaid Mobile Base of 50.8 Million in Brazil
Telefonica's Brazilian postpaid base reached 50.8 million in 2025, adding 3.3 million net customers and holding churn at 1.0%, signaling stable revenue and high ARPU stability.
This Cash Cow needs less marketing than prepaid, generates steady free cash flow, and helps Telefónica service €26.8 billion net financial debt in 2025.
O2 Germany Mobile Contract Gains of 12.1%
O2 Germany drove a 12.1% year gain in mobile contract base and delivered a striking 22.2% quarter-on-quarter rise in late 2025, signaling its shift from challenger to market leader and now ranked second in German network quality.
As a Cash Cow, it supplies high share and steady growth, underpinning Telefonica Group's €11.9 billion adjusted EBITDA in FY2025; O2 Germany's mobile contract ARPU stood at €18.6 in Q4 2025 and contract subscribers reached 22.4 million.
- 22.2% q/q mobile contract growth (late 2025)
- 12.1% y/y mobile contract gain (FY2025)
- 22.4 million contract subscribers (Q4 2025)
- €18.6 ARPU for contracts (Q4 2025)
- Contributes to €11.9bn adjusted EBITDA (FY2025)
Fixed-Mobile Convergence (FMC) Penetration
Fixed-mobile convergence in the UK and Spain now underpins Telefónica's cash flows: convergent ARPU held at ~€55/month in Spain and £48/month in the UK in 2025, showing resilience versus standalone offers.
These convergent households are Telefónica's defensive Cash Cow, protecting share against low-cost rivals and delivering stable EBITDA margins ~35% in Spain and ~32% in the UK.
By end-2025, VMO2 merger synergy gains in the UK are fully realized, adding ~€600m annual free cash flow and leaving a lean, high-return cash generator.
- Convergent ARPU: Spain €55/mo; UK £48/mo
- EBITDA margins: Spain ~35%; UK ~32%
- VMO2 synergies: ~€600m annual FCF by 2025
Telefónica '25: €11.9bn EBITDA, €2.1bn FCF, €0.30 div, 74.3m FTTH, 92% fiber
Telefónica's Cash Cows (Spain, Brazil, O2 Germany, UK convergence) generated €11.9bn adjusted EBITDA and €2.1bn FCF in FY2025, funded a €0.30/share dividend, covered ~55% group capex, and supported €26.8bn net debt; FTTH 74.3m premises passed, fiber coverage ~92%, 5G pop ~88%, Brazil postpaid 50.8m, O2 contract ARPU €18.6.
| Metric | 2025 |
|---|---|
| Adj. EBITDA (group from Cash Cows) | €11.9bn |
| Free Cash Flow (Spain) | €2.1bn |
| Net debt | €26.8bn |
| FTTH premises passed | 74.3m |
| Fiber coverage (Spain) | ~92% |
| 5G population | ~88% |
| Brazil postpaid | 50.8m |
| O2 contract ARPU | €18.6 |
What You See Is What You Get
Telefonica BCG Matrix
The file you're previewing on this page is the final Telefonica BCG Matrix you'll receive after purchase-no watermarks or demo placeholders, just a fully formatted, ready-to-use strategic report built for clarity and immediate presentation.
This preview matches the exact BCG Matrix document you'll download post-purchase, combining market-backed analysis and crisp design so the full file is ready for editing, printing, or sharing with stakeholders without further changes.
What you see is the actual deliverable: a professionally designed Telefonica BCG Matrix that becomes yours after a one-time purchase, instantly available for integration into business plans, investor decks, or executive briefings.
The report you're reviewing is precisely the same document sent to your inbox upon purchase-crafted by strategy experts, formatted for action, and ready to support competitive decisions and portfolio management straight away.

Original: $10.00
-65%$10.00
$3.50TELEFONICA BCG MATRIX TEMPLATE RESEARCH
Visual. Strategic. Downloadable.
Telefónica's BCG Matrix snapshot highlights how legacy mobile and fixed-line services act as Cash Cows funding growth areas like fiber broadband and digital services that could be Stars or Question Marks depending on regional momentum; meanwhile, underperforming legacy assets risk becoming Dogs without targeted restructuring. Dive deeper into this company's BCG Matrix and gain a clear view of where its products stand-Stars, Cash Cows, Dogs, or Question Marks. Purchase the full version for a complete breakdown and strategic insights you can act on.
Stars
Telefónica Tech Revenue Growth of 18.9%
Telefónica Tech, the group's crown jewel, grew revenue 18.9% to €2.22 billion in FY2025, driven by strong demand in Cybersecurity, Cloud and Big Data; it now outpaces the core connectivity arm with sustained double-digit momentum.
Vivo Brazil Mobile Service Revenue up 7.1%
Vivo Brazil Mobile Service Revenue up 7.1%: Telefónica's Vivo reported R$15.6 billion in Q4 2025 revenue, marking it as a high-growth Star in a consolidating market.
Vivo holds 19.3% fiber market share and a dominant mobile position, moving from growth into a cash-generating leader.
Annual net profit rose 11.2% in 2025, reflecting payoff from aggressive 5G and FTTH rollouts across Brazil.
5G Standalone (SA) Coverage at 80% to 98%
By late 2025, Telefónica's 5G Standalone (SA) coverage hit 98% in Germany and 92% in Spain, making these markets high-share leaders in a high-growth infrastructure race.
These networks are Stars in the BCG matrix because they need heavy ongoing CapEx-€2.0 billion in H1 2025-while driving future B2B and Open Gateway API revenue streams.
This CapEx funds low-latency, network-slicing and edge capabilities that underpin expected mobile data monetization over the next decade.
Telefónica Open Gateway Production APIs
Telefónica Open Gateway moved from prototype to production in 2025; partners like Itaú Bank now run 5 million SIM-swap validations monthly via its Production APIs, validating identity and reducing fraud.
This sits in Telefonica BCG Matrix as a Question/Star: Network-as-a-Service shows high growth and Telefónica holds early leadership, targeting a multi-billion market for programmable network services.
By packaging network functions as code, Telefónica unlocked a high-margin revenue stream absent in 2022; 2025 pilot-to-scale revenues are estimated at €120-€180m annual run-rate across partners.
- 5M validations/month (Itaú, SIM-swap)
- 2025 run-rate revenue €120-€180m
- Market: multi-billion Network-as-a-Service
- High growth, early leadership → Star positioning
B2B Digital Services Surging 29.5%
B2B digital services grew 29.5% in 2025, with Telefónica's Brazil B2B digital revenues hitting R$5.3 billion, showing strong leadership in enterprise IoT and AI solutions versus slower B2C trends.
High market share in corporate accounts plus rapid digital demand makes this a classic Star in Telefónica's BCG matrix, driving margin expansion and cross-sell opportunities.
- 2025 growth: 29.5%
- Brazil B2B digital revenue: R$5.3 billion (2025)
- Outstrips B2C growth; IoT/AI adoption rising
- Star: high share + high growth → invest to scale
Telefónica Tech €2.22bn; Vivo Q4 R$15.6bn, 19.3% fiber; 5G SA DE98%/ES92%
Stars: Telefónica Tech €2.22bn rev (2025,+18.9%); Vivo Brazil R$15.6bn Q4 rev, 19.3% fiber share; 5G SA coverage DE 98%/ES 92%; Network-as-a-Service run-rate €120-€180m; Brazil B2B digital R$5.3bn (+29.5%).
| Unit | 2025 |
|---|---|
| Telefónica Tech rev | €2.22bn |
| Vivo Q4 rev | R$15.6bn |
| Fiber share Vivo | 19.3% |
| 5G SA cov. (DE/ES) | 98% / 92% |
| NaaS run-rate | €120-€180m |
| Brazil B2B digital | R$5.3bn |
What is included in the product
Comprehensive BCG Matrix review of Telefónica's units with strategic actions for Stars, Cash Cows, Question Marks, and Dogs.
One-page BCG matrix placing Telefónica's units in quadrants for quick portfolio decisions and executive-ready printing.
Cash Cows
Telefónica España Best Year Since 2018
Telefónica España delivered its best year since 2018 in FY2025: revenue rose 4.2% to €12.4bn, EBITDA grew 6.8% to €5.6bn and operating cash flow (Free Cash Flow) hit €2.1bn, marking simultaneous growth in all three metrics for the first time in 17 years.
It remains Telefonica's ultimate Cash Cow, funding the group's €0.30 per-share dividend and covering ~55% of group capex in 2025.
With 5G and fiber rollouts largely complete-fiber coverage ~92% households and 5G population ~88%-the strategy shifts from building to milking the most advanced network in Europe.
Fiber-to-the-Home (FTTH) with 162.9 Million Premises
Telefónica now operates one of the world's largest fiber footprints with 74.3 million FTTH premises passed as of end-2025, contributing to a total 162.9 million premises across technologies.
FTTH is a Cash Cow: heavy build capex is largely complete, yielding high-margin, recurring subscription revenue and low churn, boosting EBITDA margins.
Premises passed grew 7% in 2025, so expansion continues but the primary role is steady, predictable cash flow supporting dividends and network services investment.
Postpaid Mobile Base of 50.8 Million in Brazil
Telefonica's Brazilian postpaid base reached 50.8 million in 2025, adding 3.3 million net customers and holding churn at 1.0%, signaling stable revenue and high ARPU stability.
This Cash Cow needs less marketing than prepaid, generates steady free cash flow, and helps Telefónica service €26.8 billion net financial debt in 2025.
O2 Germany Mobile Contract Gains of 12.1%
O2 Germany drove a 12.1% year gain in mobile contract base and delivered a striking 22.2% quarter-on-quarter rise in late 2025, signaling its shift from challenger to market leader and now ranked second in German network quality.
As a Cash Cow, it supplies high share and steady growth, underpinning Telefonica Group's €11.9 billion adjusted EBITDA in FY2025; O2 Germany's mobile contract ARPU stood at €18.6 in Q4 2025 and contract subscribers reached 22.4 million.
- 22.2% q/q mobile contract growth (late 2025)
- 12.1% y/y mobile contract gain (FY2025)
- 22.4 million contract subscribers (Q4 2025)
- €18.6 ARPU for contracts (Q4 2025)
- Contributes to €11.9bn adjusted EBITDA (FY2025)
Fixed-Mobile Convergence (FMC) Penetration
Fixed-mobile convergence in the UK and Spain now underpins Telefónica's cash flows: convergent ARPU held at ~€55/month in Spain and £48/month in the UK in 2025, showing resilience versus standalone offers.
These convergent households are Telefónica's defensive Cash Cow, protecting share against low-cost rivals and delivering stable EBITDA margins ~35% in Spain and ~32% in the UK.
By end-2025, VMO2 merger synergy gains in the UK are fully realized, adding ~€600m annual free cash flow and leaving a lean, high-return cash generator.
- Convergent ARPU: Spain €55/mo; UK £48/mo
- EBITDA margins: Spain ~35%; UK ~32%
- VMO2 synergies: ~€600m annual FCF by 2025
Telefónica '25: €11.9bn EBITDA, €2.1bn FCF, €0.30 div, 74.3m FTTH, 92% fiber
Telefónica's Cash Cows (Spain, Brazil, O2 Germany, UK convergence) generated €11.9bn adjusted EBITDA and €2.1bn FCF in FY2025, funded a €0.30/share dividend, covered ~55% group capex, and supported €26.8bn net debt; FTTH 74.3m premises passed, fiber coverage ~92%, 5G pop ~88%, Brazil postpaid 50.8m, O2 contract ARPU €18.6.
| Metric | 2025 |
|---|---|
| Adj. EBITDA (group from Cash Cows) | €11.9bn |
| Free Cash Flow (Spain) | €2.1bn |
| Net debt | €26.8bn |
| FTTH premises passed | 74.3m |
| Fiber coverage (Spain) | ~92% |
| 5G population | ~88% |
| Brazil postpaid | 50.8m |
| O2 contract ARPU | €18.6 |
What You See Is What You Get
Telefonica BCG Matrix
The file you're previewing on this page is the final Telefonica BCG Matrix you'll receive after purchase-no watermarks or demo placeholders, just a fully formatted, ready-to-use strategic report built for clarity and immediate presentation.
This preview matches the exact BCG Matrix document you'll download post-purchase, combining market-backed analysis and crisp design so the full file is ready for editing, printing, or sharing with stakeholders without further changes.
What you see is the actual deliverable: a professionally designed Telefonica BCG Matrix that becomes yours after a one-time purchase, instantly available for integration into business plans, investor decks, or executive briefings.
The report you're reviewing is precisely the same document sent to your inbox upon purchase-crafted by strategy experts, formatted for action, and ready to support competitive decisions and portfolio management straight away.
Product Information
Product Information
Shipping & Returns
Shipping & Returns
Description
Visual. Strategic. Downloadable.
Telefónica's BCG Matrix snapshot highlights how legacy mobile and fixed-line services act as Cash Cows funding growth areas like fiber broadband and digital services that could be Stars or Question Marks depending on regional momentum; meanwhile, underperforming legacy assets risk becoming Dogs without targeted restructuring. Dive deeper into this company's BCG Matrix and gain a clear view of where its products stand-Stars, Cash Cows, Dogs, or Question Marks. Purchase the full version for a complete breakdown and strategic insights you can act on.
Stars
Telefónica Tech Revenue Growth of 18.9%
Telefónica Tech, the group's crown jewel, grew revenue 18.9% to €2.22 billion in FY2025, driven by strong demand in Cybersecurity, Cloud and Big Data; it now outpaces the core connectivity arm with sustained double-digit momentum.
Vivo Brazil Mobile Service Revenue up 7.1%
Vivo Brazil Mobile Service Revenue up 7.1%: Telefónica's Vivo reported R$15.6 billion in Q4 2025 revenue, marking it as a high-growth Star in a consolidating market.
Vivo holds 19.3% fiber market share and a dominant mobile position, moving from growth into a cash-generating leader.
Annual net profit rose 11.2% in 2025, reflecting payoff from aggressive 5G and FTTH rollouts across Brazil.
5G Standalone (SA) Coverage at 80% to 98%
By late 2025, Telefónica's 5G Standalone (SA) coverage hit 98% in Germany and 92% in Spain, making these markets high-share leaders in a high-growth infrastructure race.
These networks are Stars in the BCG matrix because they need heavy ongoing CapEx-€2.0 billion in H1 2025-while driving future B2B and Open Gateway API revenue streams.
This CapEx funds low-latency, network-slicing and edge capabilities that underpin expected mobile data monetization over the next decade.
Telefónica Open Gateway Production APIs
Telefónica Open Gateway moved from prototype to production in 2025; partners like Itaú Bank now run 5 million SIM-swap validations monthly via its Production APIs, validating identity and reducing fraud.
This sits in Telefonica BCG Matrix as a Question/Star: Network-as-a-Service shows high growth and Telefónica holds early leadership, targeting a multi-billion market for programmable network services.
By packaging network functions as code, Telefónica unlocked a high-margin revenue stream absent in 2022; 2025 pilot-to-scale revenues are estimated at €120-€180m annual run-rate across partners.
- 5M validations/month (Itaú, SIM-swap)
- 2025 run-rate revenue €120-€180m
- Market: multi-billion Network-as-a-Service
- High growth, early leadership → Star positioning
B2B Digital Services Surging 29.5%
B2B digital services grew 29.5% in 2025, with Telefónica's Brazil B2B digital revenues hitting R$5.3 billion, showing strong leadership in enterprise IoT and AI solutions versus slower B2C trends.
High market share in corporate accounts plus rapid digital demand makes this a classic Star in Telefónica's BCG matrix, driving margin expansion and cross-sell opportunities.
- 2025 growth: 29.5%
- Brazil B2B digital revenue: R$5.3 billion (2025)
- Outstrips B2C growth; IoT/AI adoption rising
- Star: high share + high growth → invest to scale
Telefónica Tech €2.22bn; Vivo Q4 R$15.6bn, 19.3% fiber; 5G SA DE98%/ES92%
Stars: Telefónica Tech €2.22bn rev (2025,+18.9%); Vivo Brazil R$15.6bn Q4 rev, 19.3% fiber share; 5G SA coverage DE 98%/ES 92%; Network-as-a-Service run-rate €120-€180m; Brazil B2B digital R$5.3bn (+29.5%).
| Unit | 2025 |
|---|---|
| Telefónica Tech rev | €2.22bn |
| Vivo Q4 rev | R$15.6bn |
| Fiber share Vivo | 19.3% |
| 5G SA cov. (DE/ES) | 98% / 92% |
| NaaS run-rate | €120-€180m |
| Brazil B2B digital | R$5.3bn |
What is included in the product
Comprehensive BCG Matrix review of Telefónica's units with strategic actions for Stars, Cash Cows, Question Marks, and Dogs.
One-page BCG matrix placing Telefónica's units in quadrants for quick portfolio decisions and executive-ready printing.
Cash Cows
Telefónica España Best Year Since 2018
Telefónica España delivered its best year since 2018 in FY2025: revenue rose 4.2% to €12.4bn, EBITDA grew 6.8% to €5.6bn and operating cash flow (Free Cash Flow) hit €2.1bn, marking simultaneous growth in all three metrics for the first time in 17 years.
It remains Telefonica's ultimate Cash Cow, funding the group's €0.30 per-share dividend and covering ~55% of group capex in 2025.
With 5G and fiber rollouts largely complete-fiber coverage ~92% households and 5G population ~88%-the strategy shifts from building to milking the most advanced network in Europe.
Fiber-to-the-Home (FTTH) with 162.9 Million Premises
Telefónica now operates one of the world's largest fiber footprints with 74.3 million FTTH premises passed as of end-2025, contributing to a total 162.9 million premises across technologies.
FTTH is a Cash Cow: heavy build capex is largely complete, yielding high-margin, recurring subscription revenue and low churn, boosting EBITDA margins.
Premises passed grew 7% in 2025, so expansion continues but the primary role is steady, predictable cash flow supporting dividends and network services investment.
Postpaid Mobile Base of 50.8 Million in Brazil
Telefonica's Brazilian postpaid base reached 50.8 million in 2025, adding 3.3 million net customers and holding churn at 1.0%, signaling stable revenue and high ARPU stability.
This Cash Cow needs less marketing than prepaid, generates steady free cash flow, and helps Telefónica service €26.8 billion net financial debt in 2025.
O2 Germany Mobile Contract Gains of 12.1%
O2 Germany drove a 12.1% year gain in mobile contract base and delivered a striking 22.2% quarter-on-quarter rise in late 2025, signaling its shift from challenger to market leader and now ranked second in German network quality.
As a Cash Cow, it supplies high share and steady growth, underpinning Telefonica Group's €11.9 billion adjusted EBITDA in FY2025; O2 Germany's mobile contract ARPU stood at €18.6 in Q4 2025 and contract subscribers reached 22.4 million.
- 22.2% q/q mobile contract growth (late 2025)
- 12.1% y/y mobile contract gain (FY2025)
- 22.4 million contract subscribers (Q4 2025)
- €18.6 ARPU for contracts (Q4 2025)
- Contributes to €11.9bn adjusted EBITDA (FY2025)
Fixed-Mobile Convergence (FMC) Penetration
Fixed-mobile convergence in the UK and Spain now underpins Telefónica's cash flows: convergent ARPU held at ~€55/month in Spain and £48/month in the UK in 2025, showing resilience versus standalone offers.
These convergent households are Telefónica's defensive Cash Cow, protecting share against low-cost rivals and delivering stable EBITDA margins ~35% in Spain and ~32% in the UK.
By end-2025, VMO2 merger synergy gains in the UK are fully realized, adding ~€600m annual free cash flow and leaving a lean, high-return cash generator.
- Convergent ARPU: Spain €55/mo; UK £48/mo
- EBITDA margins: Spain ~35%; UK ~32%
- VMO2 synergies: ~€600m annual FCF by 2025
Telefónica '25: €11.9bn EBITDA, €2.1bn FCF, €0.30 div, 74.3m FTTH, 92% fiber
Telefónica's Cash Cows (Spain, Brazil, O2 Germany, UK convergence) generated €11.9bn adjusted EBITDA and €2.1bn FCF in FY2025, funded a €0.30/share dividend, covered ~55% group capex, and supported €26.8bn net debt; FTTH 74.3m premises passed, fiber coverage ~92%, 5G pop ~88%, Brazil postpaid 50.8m, O2 contract ARPU €18.6.
| Metric | 2025 |
|---|---|
| Adj. EBITDA (group from Cash Cows) | €11.9bn |
| Free Cash Flow (Spain) | €2.1bn |
| Net debt | €26.8bn |
| FTTH premises passed | 74.3m |
| Fiber coverage (Spain) | ~92% |
| 5G population | ~88% |
| Brazil postpaid | 50.8m |
| O2 contract ARPU | €18.6 |
What You See Is What You Get
Telefonica BCG Matrix
The file you're previewing on this page is the final Telefonica BCG Matrix you'll receive after purchase-no watermarks or demo placeholders, just a fully formatted, ready-to-use strategic report built for clarity and immediate presentation.
This preview matches the exact BCG Matrix document you'll download post-purchase, combining market-backed analysis and crisp design so the full file is ready for editing, printing, or sharing with stakeholders without further changes.
What you see is the actual deliverable: a professionally designed Telefonica BCG Matrix that becomes yours after a one-time purchase, instantly available for integration into business plans, investor decks, or executive briefings.
The report you're reviewing is precisely the same document sent to your inbox upon purchase-crafted by strategy experts, formatted for action, and ready to support competitive decisions and portfolio management straight away.


